

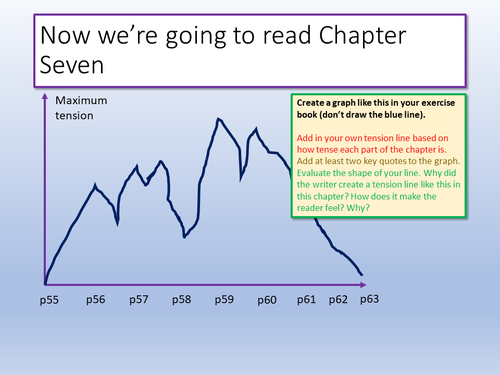

As we continue to study Tom Becker’s Darkside, we look at how the writer builds up tension in Chapter Seven and plot out a tension graph based on the changing tension within the chapter. A really useful lesson for KS3 students and some interesting activities that could be adapted for KS4. Fully differentiated throughout.
Get this resource as part of a bundle and save up to 63%
A bundle is a package of resources grouped together to teach a particular topic, or a series of lessons, in one place.
Something went wrong, please try again later.
This resource hasn't been reviewed yet
To ensure quality for our reviews, only customers who have purchased this resource can review it
Report this resourceto let us know if it violates our terms and conditions.
Our customer service team will review your report and will be in touch.
£2.00