

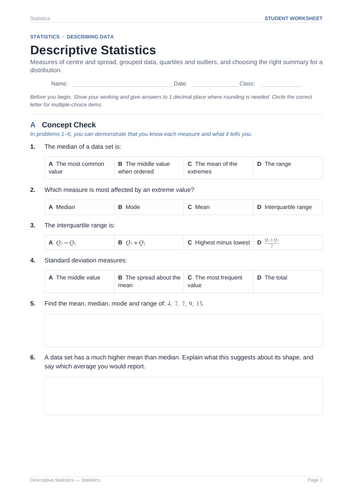

Master descriptive statistics with this Data Analysis worksheet! Covers measures of central tendency and spread, grouped data calculations, box plot construction and interpretation, outlier testing, comparing distributions, linear transformations of data, and answer key.
This comprehensive 5-page student worksheet is designed to help students master key concepts in descriptive statistics and data representation. It guides learners step-by-step from core definitions of center and spread to computing grouped estimates, reading histograms and box plots, testing for outliers, and analyzing how transformations affect statistical measures.
What is Included:
Section A: Concept Check. Evaluates foundational understanding of measures of center (mean, median, mode) and spread (range, IQR, standard deviation), identifying the impact of extreme values, and determining appropriate averages for skewed distributions.
Section B: Measures of Centre. Focuses on calculating mean, median, and mode for odd and even data sets, solving for missing values given a mean, updating combined averages when new data points join, and identifying contexts where the mode is the primary measure.
Section C: Measures of Spread. Guides students through calculating range, quartiles (Q1, Q2, Q3), interquartile range (IQR), and standard deviation, comparing variability between data sets, and applying the 1.5 x IQR rule to detect outliers.
Section D: Grouped Data. Covers estimating the mean using class midpoints, identifying modal and median classes, understanding why grouped means are approximations, and evaluating histogram skewness.
Section E: Box Plots and Comparison. Focuses on reading 5-number summaries and interquartile ranges directly from box plots, constructing accurate box plots from given summary statistics, and writing formal comparisons of center and spread between distributions.
Section F: Applications and Challenge. Features conceptual challenge problems analyzing how adding or multiplying constants affects mean, median, range, and standard deviation, as well as calculating how removing specific values alters the overall mean.
Teacher Benefits:
Ready to Print & Go – Zero prep required. Excellent for structured classroom instruction, targeted homework, review sessions, or assessment preparation.
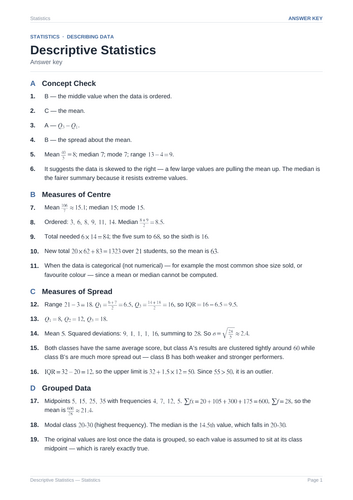
Complete Solutions Included – Comes with a fully worked answer key detailing conceptual checks, step-by-step arithmetic setups, exact decimal evaluations, and distribution comparisons.
Something went wrong, please try again later.
This resource hasn't been reviewed yet
To ensure quality for our reviews, only customers who have purchased this resource can review it
Report this resourceto let us know if it violates our terms and conditions.
Our customer service team will review your report and will be in touch.
£4.00