
This is a full 1 hour GCSE lesson that introduces the Burgess Model, urbanisation, counter-urbanisation, sub-urbanisation, de-industrialisation and regeneration through a case study of New York City. The lesson is part of a unit on urban change on the Ed-Excel B spec, though it could easily be adapted to other specifications.
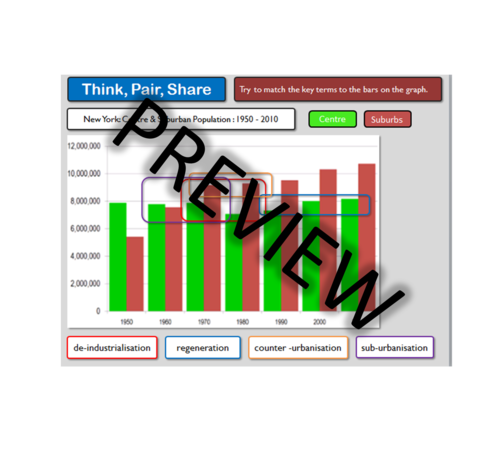
Learning Outcome 1 - 'I understand that urban population, distribution and spatial growth change over time.'
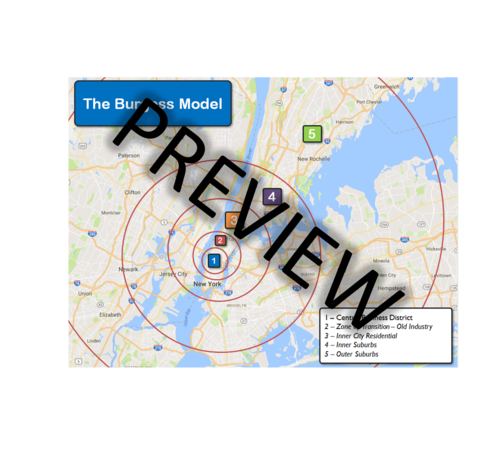
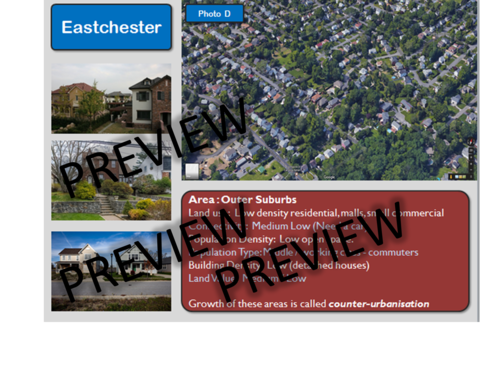
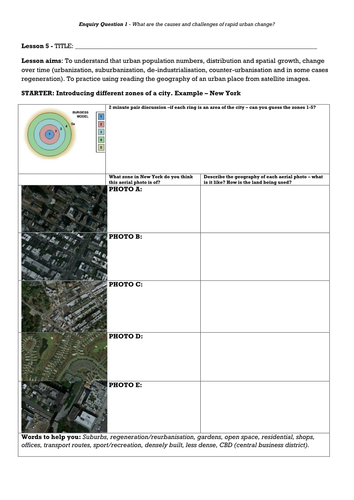
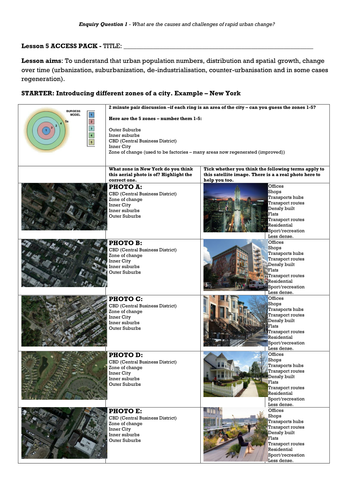
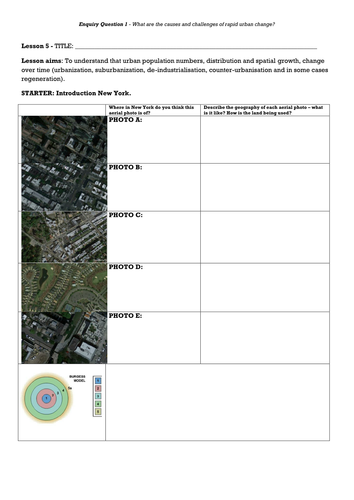
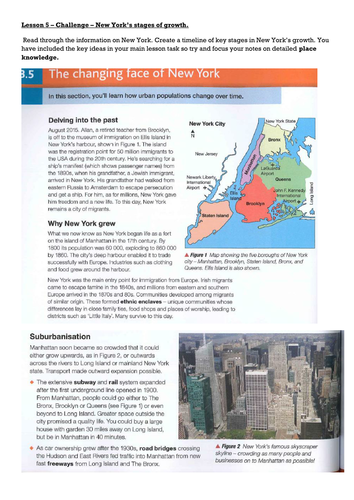
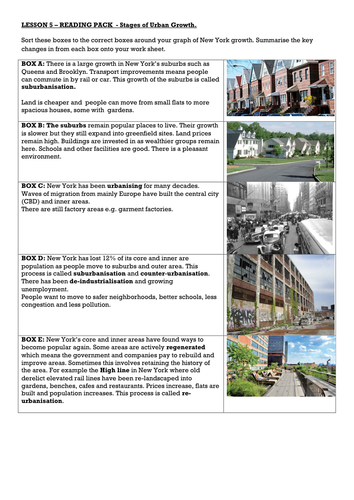
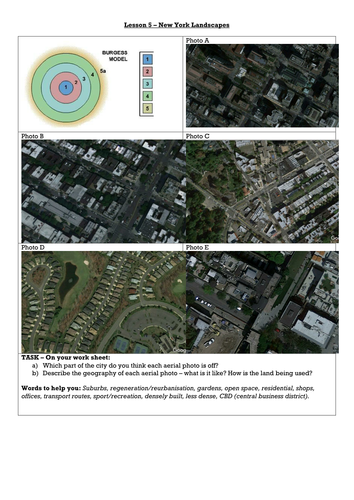
In the lesson the students will explore a variety of locations in New York City ranging from CBD to the Outer Suburbs using 3D models and satellite images to identify changes in a standard set of attributes. As the journey commences we will highlight spatial links and difference between places. The Burgess model is applied at every step. New York was chosen as the subject to give some students some variety of place rather than simply focusing on the UK.
Ease of use is the aim, so the lesson includes a compact presentation with instructions and guidance in the notes section below each slide, it also includes referenced, differentiated handouts with printing instructions and is of course, proof read.
Please feel free to leave a review :)
Happy teaching!
Learning Outcome 1 - 'I understand that urban population, distribution and spatial growth change over time.'
In the lesson the students will explore a variety of locations in New York City ranging from CBD to the Outer Suburbs using 3D models and satellite images to identify changes in a standard set of attributes. As the journey commences we will highlight spatial links and difference between places. The Burgess model is applied at every step. New York was chosen as the subject to give some students some variety of place rather than simply focusing on the UK.
Ease of use is the aim, so the lesson includes a compact presentation with instructions and guidance in the notes section below each slide, it also includes referenced, differentiated handouts with printing instructions and is of course, proof read.
Please feel free to leave a review :)
Happy teaching!
Get this resource as part of a bundle and save up to 7%
A bundle is a package of resources grouped together to teach a particular topic, or a series of lessons, in one place.
Something went wrong, please try again later.
This resource hasn't been reviewed yet
To ensure quality for our reviews, only customers who have purchased this resource can review it
Report this resourceto let us know if it violates our terms and conditions.
Our customer service team will review your report and will be in touch.
£3.99