


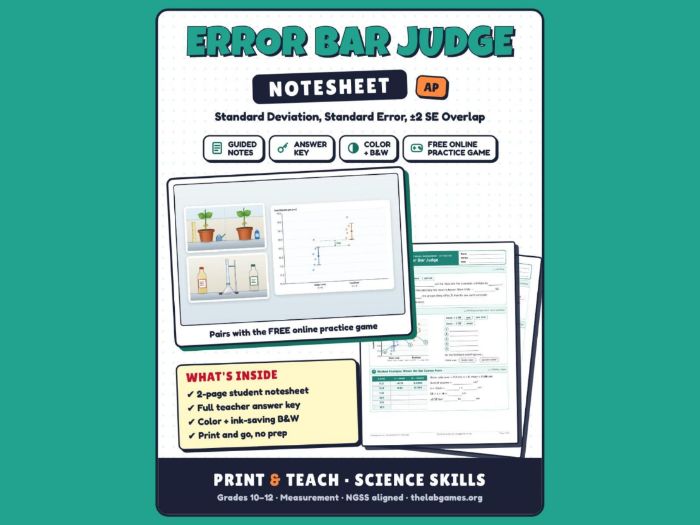
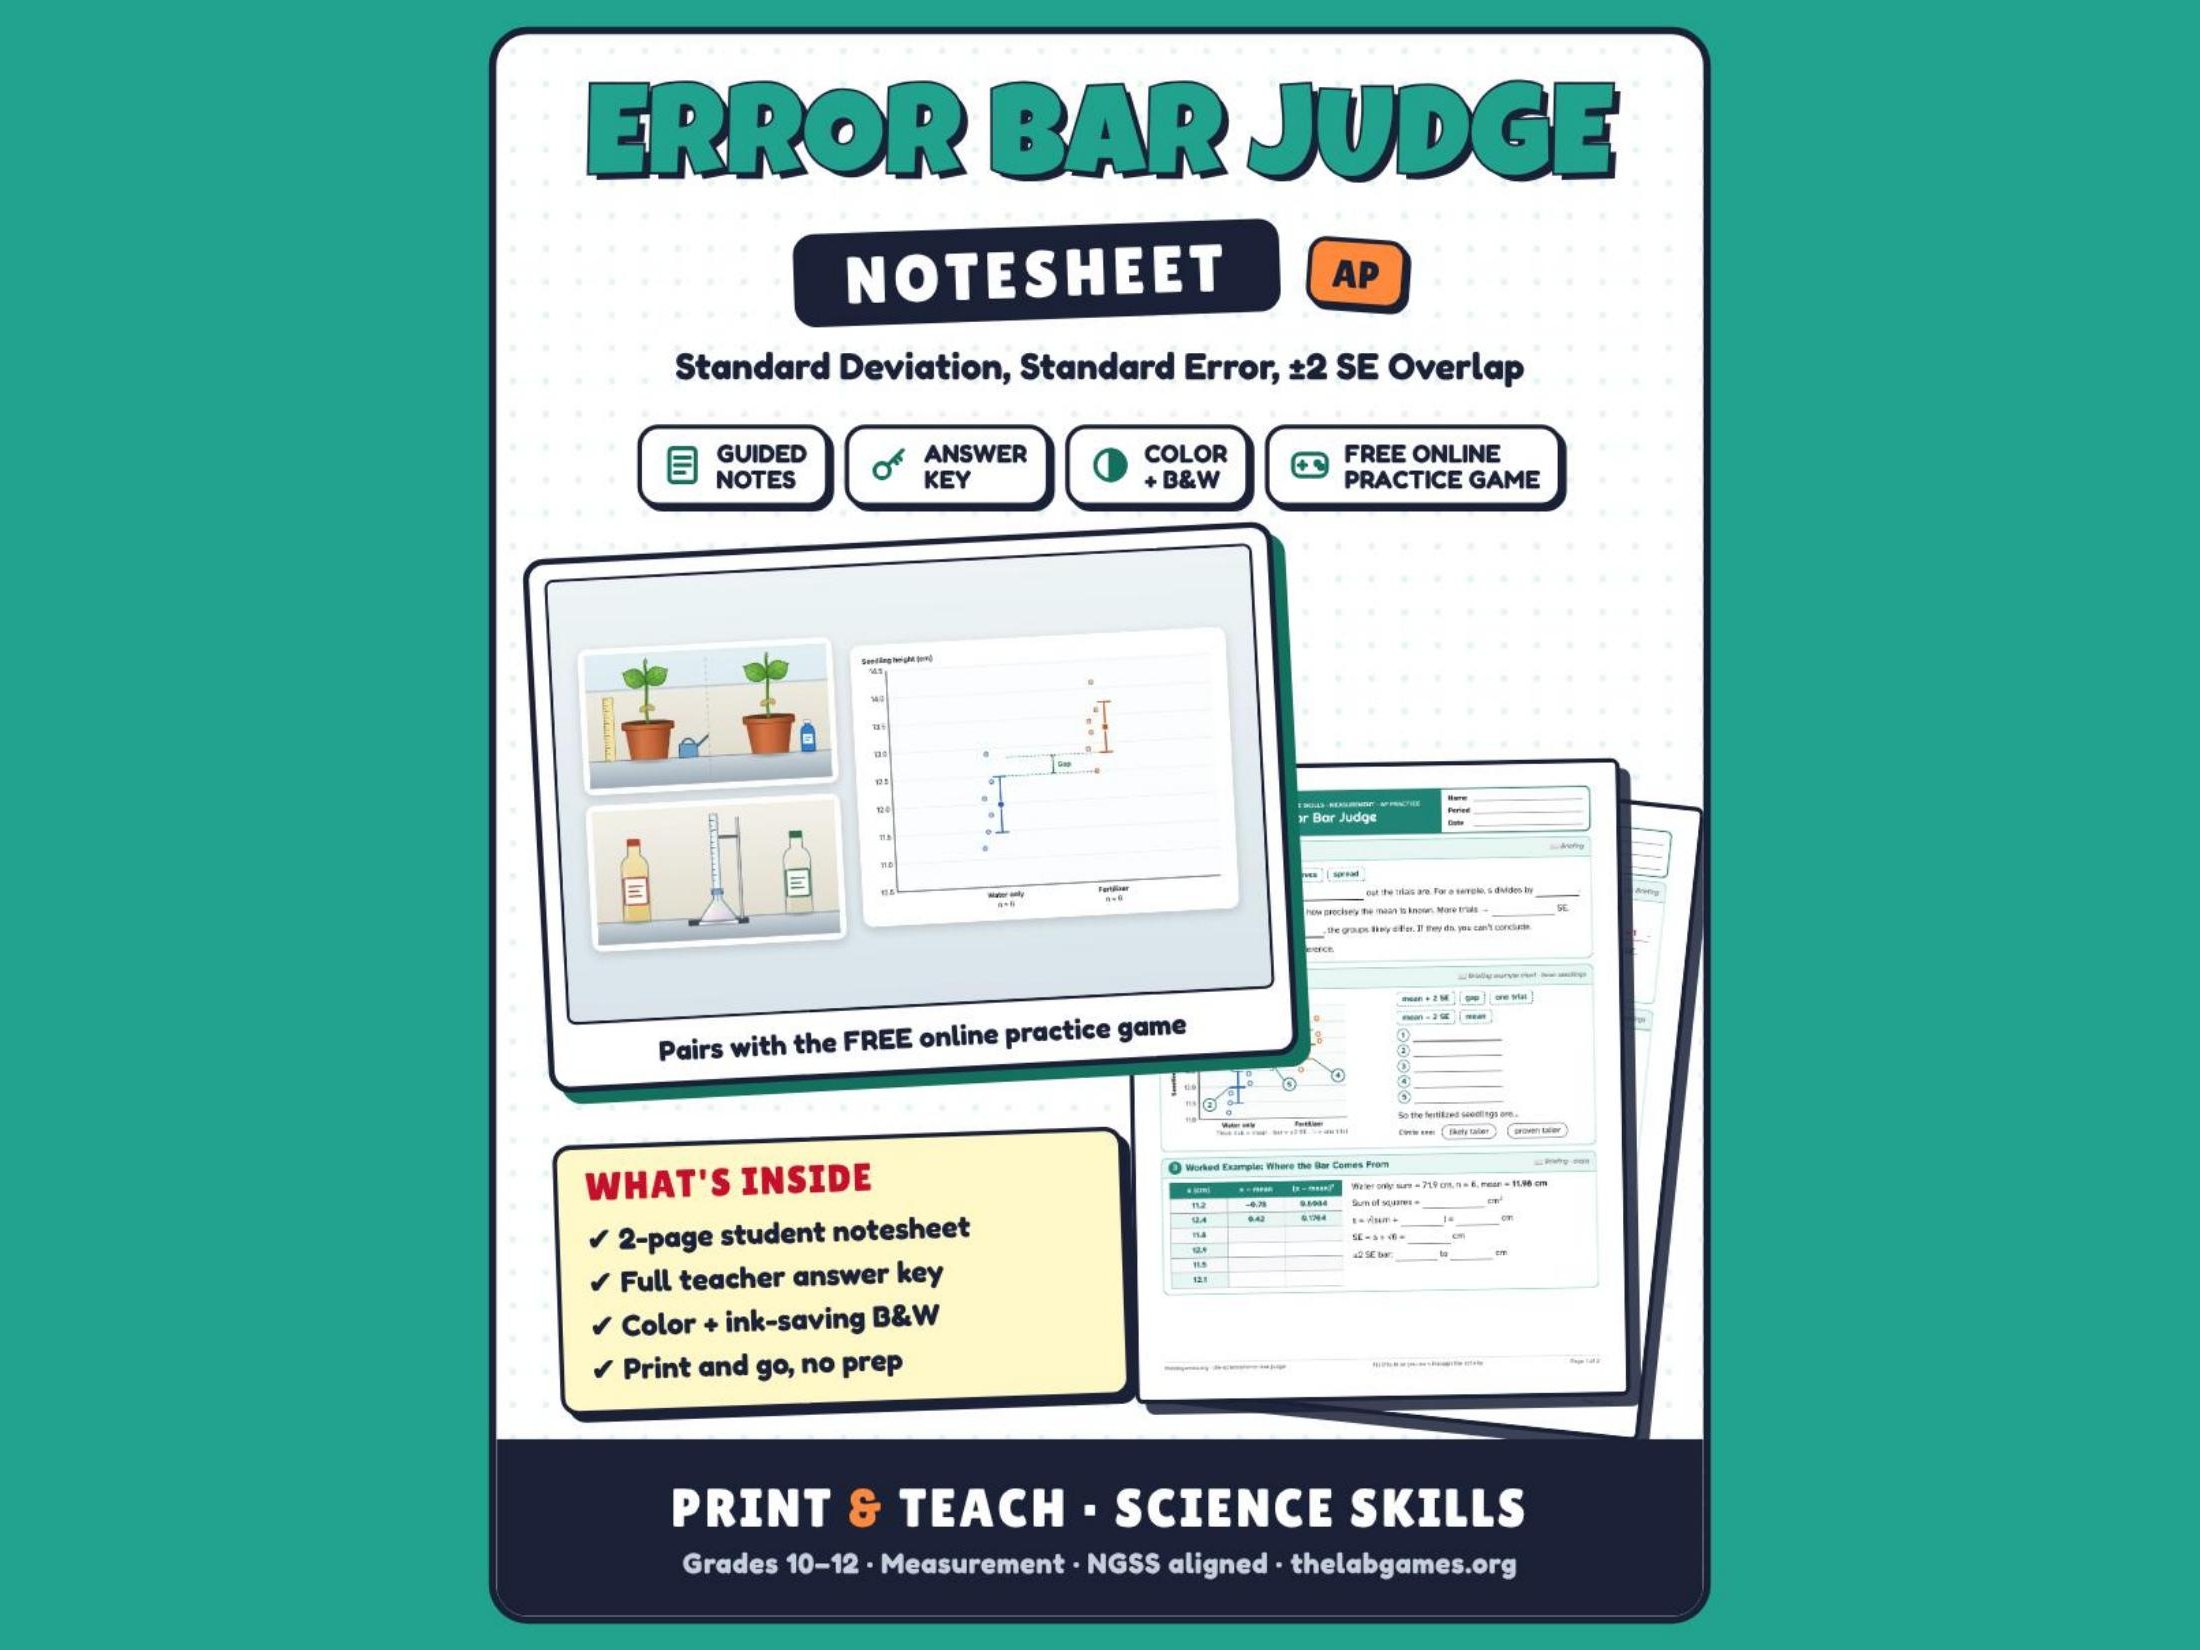
Decide when two groups really differ. In this roomy, student-friendly 2-page notesheet, students fill in the background on standard deviation (dividing by n − 1), standard error and what overlapping ±2 SE bars do and do not mean, then label a chart of real-looking bean seedling data (one trial, the mean, mean + 2 SE, mean − 2 SE and the gap between the bars). A worked example walks through the deviation table, the sum of squares, s, SE and the ends of the error bar step by step. On page 2 they work four judge’s orders: the mean, s, SE and ±2 SE bar for one group of tennis-ball bounces, standard errors and a conclusion from two summary tables (one with unequal sample sizes), and reading a finished error-bar chart.
It pairs with Error Bar Judge, a free online AP practice game at thelabgames.org where students judge real-world experiments in biology, chemistry, environmental science and physics by their error bars. Use it in class, for absent-student makeups, or on sub days. A complete teacher key is included.
What’s Included
- Student notesheet (2 pages) in full color AND black & white
- Teacher answer key (red answers) in full color AND black & white
What Students Do
- Background fill-in: spread and standard deviation, n − 1, standard error and sample size, overlap vs. no overlap, why data never prove a difference
- Read a ±2 SE Chart: label a trial, the mean, both ends of the bars and the gap; choose “likely” over “proven”
- Worked Example: complete a deviation table, then find the sum of squares, s, SE and the ±2 SE bar
- Judge’s Orders: one group’s full statistics, two summary tables (SE and a conclusion), and an error-bar chart to read and judge
- Key Ideas and My Runs: SE vs. s, overlap does not mean equal, and a log for tracking practice scores
Skills & Standards
- Mean, sample standard deviation (n − 1), standard error of the mean, ±2 SE error bars, comparing groups, likely vs. proven, reading charts with error bars
- Supports NGSS SEP 4 (Analyzing and Interpreting Data) and SEP 5 (Using Mathematics and Computational Thinking)
- Grades 10–12 AP Biology (also AP Chemistry, AP Environmental Science and AP Physics)
Great For
- AP science skills and lab-report units
- Absent-student makeups
- Sub plans
- Homework or stations
- AP exam review (statistics on the AP Biology formula sheet)
Something went wrong, please try again later.
This resource hasn't been reviewed yet
To ensure quality for our reviews, only customers who have purchased this resource can review it
Report this resourceto let us know if it violates our terms and conditions.
Our customer service team will review your report and will be in touch.
$2.49