
New GCSE AQA Physics lesson on ‘Velocity - time graphs’ written in line with new AQA Physics specification.
Starter prompts pupils to discuss what would win a race, a sports car on the road or a car falling from the sky in a mile race. Pupils are then asked to put cars in order acceleration in terms of 0-60 mph.
The difference between speed and velocity is highlighted.
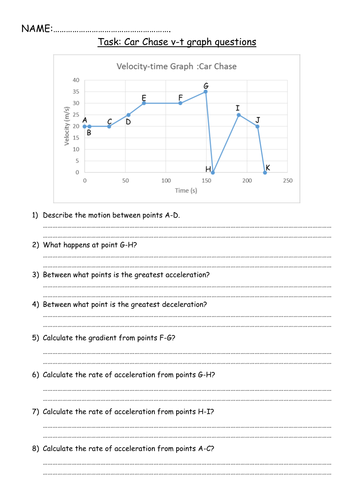
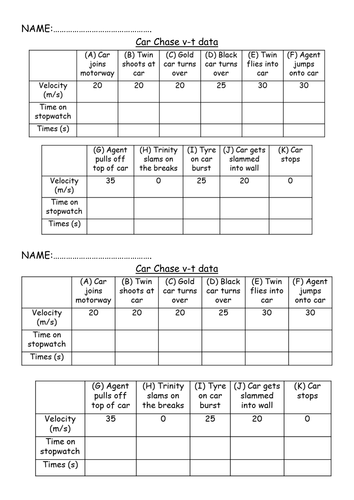
A class activity uses a video car chase for pupils to time the duration of different events which is then used to create a velocity time graph. This allows for the v-t graph to be discussed in terms of what the trends show.
Key v-t graph trends are highlighted and reviewed with how gradients of v-t graphs can give acceleration. Pupils are then tasked to answer questions in relation to the v-t graph from the car chase video.
A quick task requires pupils to match v-t graph trends with d-t graph trends.
The plenary takes a look at a v-t graph for a sky diver to start discussing this area.
Lesson Objectives:
- Plot a v-t graph.
- Identify key v-t graph trends.
- Use the gradient of a v-t graph to calculate the acceleration of an object.
- Analyse motion of a body using a v-t graph.
Something went wrong, please try again later.
A nicely chunked lesson that my foundation students will be able to access. I couldn't have made a better presentation myself; has saved me LOADS of time. Thank you!
A really excellent lesson which my year 10 students enjoyed. Thanks very much.
Report this resourceto let us know if it violates our terms and conditions.
Our customer service team will review your report and will be in touch.
£3.00