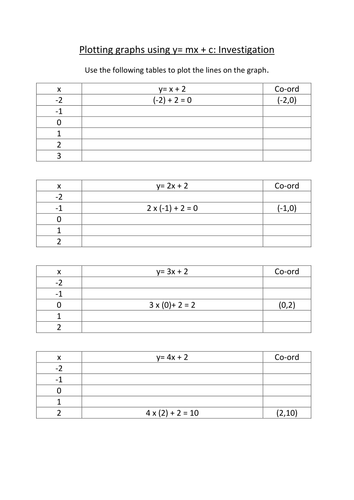


A worksheet that practices using a table to plot straight lines then uses the similarities and differences to compare with the equation of the line and eventually lead to gradient and intercept with y=mx+c.
Something went wrong, please try again later.
This resource hasn't been reviewed yet
To ensure quality for our reviews, only customers who have purchased this resource can review it
Report this resourceto let us know if it violates our terms and conditions.
Our customer service team will review your report and will be in touch.
£2.00