


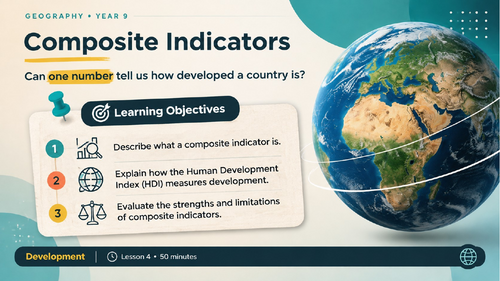
Can one number really tell us how developed a country is?
Challenge students to think critically about how development is measured with this engaging, visually appealing KS3 and Middle School Geography PowerPoint lesson exploring composite development indicators, global inequalities and the Human Development Index (HDI).
Designed for Year 9 (UK), Grades 8–9 (USA) and international schools, this ready-to-teach lesson combines real-world statistics, geographical analysis, interactive discussion and an independent research project.
What’s Included?
- Engaging starter: Compare two fictional countries with contrasting income, life expectancy and education statistics. Which is more developed?
- Understanding composite indicators: Discover why geographers combine several measures to assess development.
- Human Development Index (HDI): Explore how health, education and income contribute to measuring development.
- Real-world HDI comparisons: Analyse published 2023 HDI data for Iceland, Norway and Switzerland.
- Inequality-adjusted HDI (IHDI): Investigate how national averages can conceal differences in opportunity and living standards.
- Evaluating HDI: Sort and justify the strengths and limitations of this widely used development indicator.
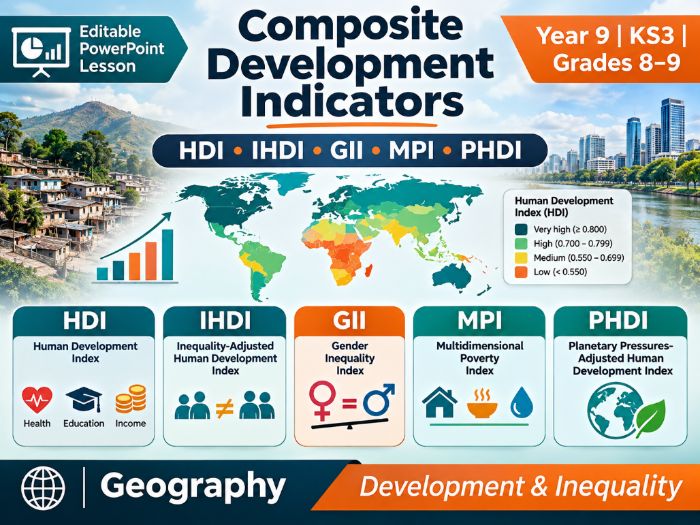
- Beyond HDI: Introduce four important UNDP composite indices:
- IHDI – Inequality-adjusted Human Development Index
- GII – Gender Inequality Index
- MPI – Multidimensional Poverty Index
- PHDI – Planetary pressures-adjusted Human Development Index
- Final Data Detective Project: Students independently investigate two composite indices, examine global distribution patterns using maps, explain how each index measures development and evaluate their usefulness.
- Teacher guidance: Suggested timings, answers and links to UNDP data sources.
Why Teachers Will Love This Resource
This lesson moves beyond memorising definitions, encouraging students to interpret geographical data, identify global patterns, question national averages and evaluate the reliability of development measurements.
Activities are structured to promote discussion, analytical thinking and independent geographical enquiry, with extension opportunities for higher-attaining students.
Ideal For
UK KS3 Geography – Year 9
US Middle School Geography – Grades 8–9
International Geography programmes
Global Development and Inequality units
Introducing skills needed for IGCSE/GCSE Geography
Resource format: Editable PowerPoint presentation
Lesson duration: Approximately 50 minutes, with a research activity that can be extended into homework.
Data: Includes published UNDP Human Development Report 2025 statistics (2023 observations) and links to further research.
A valuable follow-up to an introductory What Is Development? lesson, helping students develop a deeper understanding of how geographers measure and evaluate global development.
Something went wrong, please try again later.
This resource hasn't been reviewed yet
To ensure quality for our reviews, only customers who have purchased this resource can review it
Report this resourceto let us know if it violates our terms and conditions.
Our customer service team will review your report and will be in touch.
£2.00