


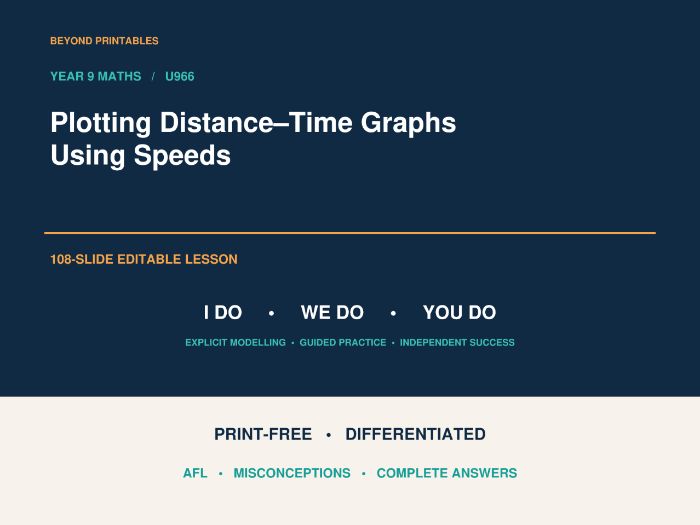
Turn speed and time information into accurate distance–time graphs with this editable 108-slide Year 9 maths PowerPoint. Pupils progress from simple outward journeys to stops, changing speeds and returns home, then tackle reverse problems using overall average speed.
Designed to give teachers clear modelling, substantial practice and quick checks of understanding, this lesson includes an 18-question practice page and a one-page differentiated task alongside enlarged activities for flexible classroom use.
WHAT MAKES THIS LESSON USEFUL?
• Six paired modelling examples build from calculating an endpoint to plotting multi-stage journeys. A compact overview leaves room for teacher working, with enlarged examples and worked solutions to follow.
• An 18-question practice page uses three shared grids: outward journeys, continuing away after a stop, and returning home. Multiple lines on each grid help pupils compare how speed changes the graph.
• One-page differentiation brings together six Developing, four Secure and three Greater Depth questions, plus a Super Challenge. Pupils move from direct calculations to finding missing speeds, stop durations and explaining whether a target average is possible.
• Twenty mini-whiteboard checks use short calculations, coordinates, explanations and graph choices. Each question is immediately followed by its answer.
• Clear graph scales, labelled axes and worked graphs support accurate plotting and efficient feedback.
TOPICS COVERED
Calculating distance from speed and time; converting minutes to hours; calculating journey durations; using elapsed time; plotting stops and return journeys; combining journey stages; and solving problems involving whole-journey average speed.
ALSO INCLUDED
Six retrieval questions and answers; six prerequisite checks and answers; further examples; additional practice; a misconception check on elapsed time; a six-mark exam-style question with worked answer and mark allocation; and three short exit checks with answers.
The Super Challenge asks pupils to deduce two unknown speeds from a journey’s overall average and the relationship between its outward and return speeds, then draw the graph. A complete solution is included.
YOUR DOWNLOAD
One editable PowerPoint containing the lesson, activities, graphs and answers. Adapt the questions, select the practice format that suits your class and teach at your own pace.
Something went wrong, please try again later.
This resource hasn't been reviewed yet
To ensure quality for our reviews, only customers who have purchased this resource can review it
Report this resourceto let us know if it violates our terms and conditions.
Our customer service team will review your report and will be in touch.
£3.00