

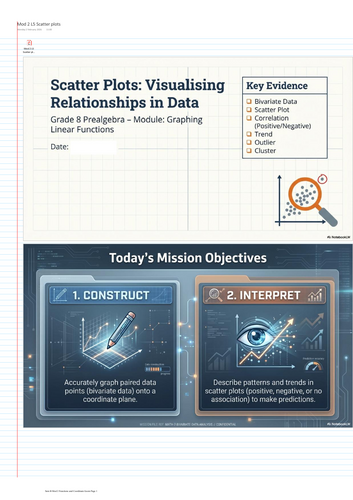

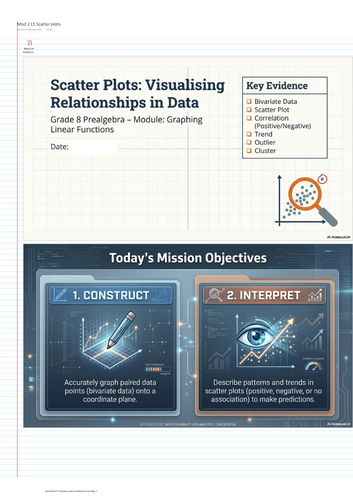
Scatter Plots: Visualizing Relationships in Data
Included:
Scaffolded learning objectives and success criteria
Complete answer key
Plotting and interpreting bivariate data
Positive, negative, and no correlation
Identifying trends, outliers, and clusters
Real-world contextual problems
Using trends to estimate values
Error analysis and reasoning
Challenge problems involving non-linear patterns and clustering
Student self-assessment
Description:
Help students understand how scatter plots can be used to visualize and interpret relationships between two variables. Students learn to plot bivariate data, identify positive, negative, and no correlation, recognize outliers and clusters, and use trends to make estimates. Real-world examples, error analysis, contextual problems, and challenge activities help students develop both data interpretation and mathematical reasoning skills.
Something went wrong, please try again later.
This resource hasn't been reviewed yet
To ensure quality for our reviews, only customers who have purchased this resource can review it
Report this resourceto let us know if it violates our terms and conditions.
Our customer service team will review your report and will be in touch.
£3.00