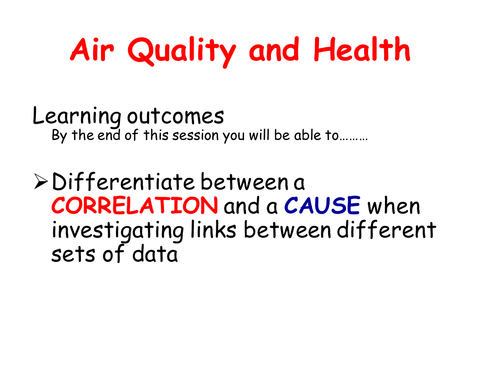


A lesson originally put together for OCR 21st Century Science C1 (Foundation - weak students) with significant challenge but would be equally applicable for any exam board (AQA, EDEXCEL etc) to illustrate the concept of Cause and Correlation. Observed during inspection with this lesson. Very successful outcome.
Potentially dry topic. Use a clearly incongruous link, in this case ice cream sales and hayfever cases lnked to pollen count to illustrate the difference between a 'cause' and a 'correlation'. The graphs for this are in the attached powerpoint.
Once the difference has been highlighted, move on to collaborative work in the class with the attached work on nitrogen monoxide levels and hayfever and the instances of asthma in a given area. Graphs to be completed using the data on the sheets and the questions about the completed graphs also to be done.
Differentiated starter questions are also attached (D- B grade).
Something went wrong, please try again later.
This resource hasn't been reviewed yet
To ensure quality for our reviews, only customers who have purchased this resource can review it
Report this resourceto let us know if it violates our terms and conditions.
Our customer service team will review your report and will be in touch.
£3.00
