


This set of resources contains everything you need to teach the topic of inequalities on graphs.
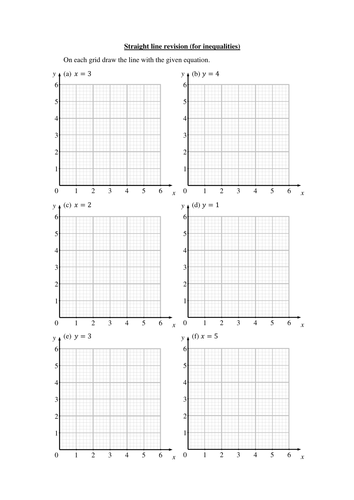
The students need to be confident with straight line graphs for this topic so the first worksheet is a refresher of those.
Next is a powerpoint with worked examples of finding the single inequality represented by a shaded region.
The worksheet that follows practises finding the single inequality that describes the given shaded region (4 pages).
The next worksheet practises finding the 3 inequalities that describe the given shaded region (4 pages).
The worksheet "Inequalities on graphs" gives students lots of practice drawing the shaded region (both single and multiple inequalities) and finding inequalities for shaded regions (10 pages).
The final resource is intended as a homework or summative assessment (4 pages).
All answers are included for printing/projecting for your class to check their answers.
Something went wrong, please try again later.
This resource hasn't been reviewed yet
To ensure quality for our reviews, only customers who have purchased this resource can review it
Report this resourceto let us know if it violates our terms and conditions.
Our customer service team will review your report and will be in touch.
£5.00