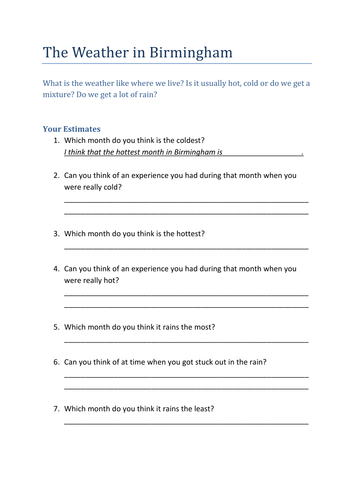
Worksheets with real data about the weather in Birmingham, UK.
Pupils firstly think for themselves to estimate which months they think are hottest, coldest, most and least rainy, using their own experiences.
They are then given a basic table with the facts about temperature and rainfall.
Pupils are asked similar questions using the data they have been given and work out the average temperatures for the summer and the winter.
Finally, pupils plot a bar graph and line graph showing the rainfall and temperature they have found out.
As an extension, I asked pupils to use the internet to research the same data for a city in another country, fill in a blank table and another graph. They then wrote comparisons of the two cities.
Something went wrong, please try again later.
This resource hasn't been reviewed yet
To ensure quality for our reviews, only customers who have purchased this resource can review it
Report this resourceto let us know if it violates our terms and conditions.
Our customer service team will review your report and will be in touch.
£2.00
