
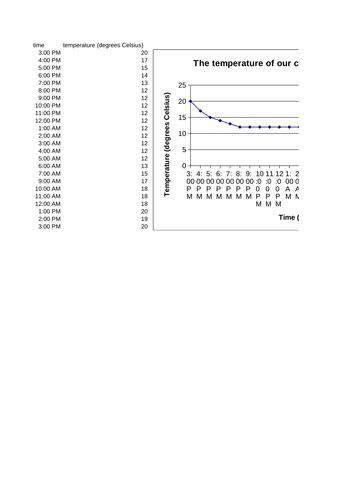
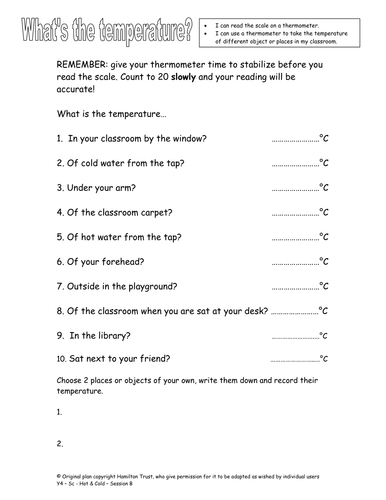
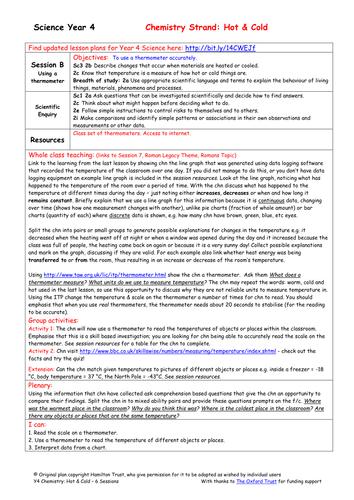
Look at a line graph of temperature changes in the classroom over 24hrs and explain why it goes up and down. Establish how to use a thermometer accurately and safely, including a close look at different scales. Look at a range of temperatures of different places or objects.
Suitable for Year 4 pupils.
Find other lesson plans and resources at www.hamilton-trust.org.uk.
Suitable for Year 4 pupils.
Find other lesson plans and resources at www.hamilton-trust.org.uk.
Something went wrong, please try again later.
Good lesson, web-link broken to the Standards site, find it at 'Teachfind'
Report this resourceto let us know if it violates our terms and conditions.
Our customer service team will review your report and will be in touch.
£0.00