


This is a resource designed for Year 3 students to help them read off and draw elements of bar graphs, pictograms and tables of data.
This resource contains PDF and Word versions of the following:
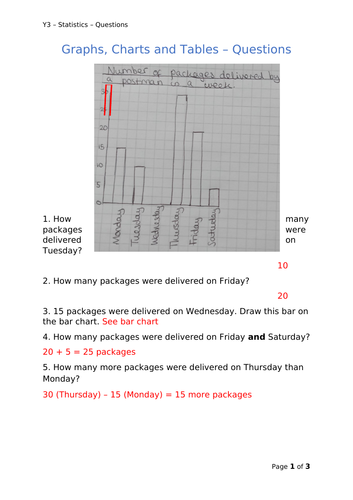
- A help sheet showing and explaining the how to read bar charts, pictograms and data tables, with worked examples for each.
- An extended question sheet including questions covering all the data representation methods covered on the help sheets.
- An answer sheet for teacher use or student consolidation.
If you use this resource, please help to support me by leaving a review!
Many thanks,
Sam :)
Get this resource as part of a bundle and save up to 60%
A bundle is a package of resources grouped together to teach a particular topic, or a series of lessons, in one place.
Bundle
Year 3 Maths Bundle
This bundle comprises every paid Year 3 resource available in my shop. Each resource contains: * A help sheet for each topic with worked examples for most. * An extensive question sheet, with a variety of question types and, where possible, challenging word problems to help develop reasoning skills * An answer sheet for teacher use or student self-consolidation. Buying this bundle will save you 60% compared to buying every resource separately, or 40% from buying every topic-specific bundle separately. If you use this resource, be sure to help support me by liking or leaving a review! Thanks, Sam :)
£13.00
Bundle
Y3 Maths - Geometry and Statistics Bundle
This is a bundle comprised of all my resources covering the geometry and statistics topics for Year 3 students. All documents within each resource are supplied in both PDF and Word formats. If you use this bundle, be sure to help support me by leaving a review! Many thanks, Sam :)
£4.00
Something went wrong, please try again later.
This resource hasn't been reviewed yet
To ensure quality for our reviews, only customers who have purchased this resource can review it
Report this resourceto let us know if it violates our terms and conditions.
Our customer service team will review your report and will be in touch.
£2.00