
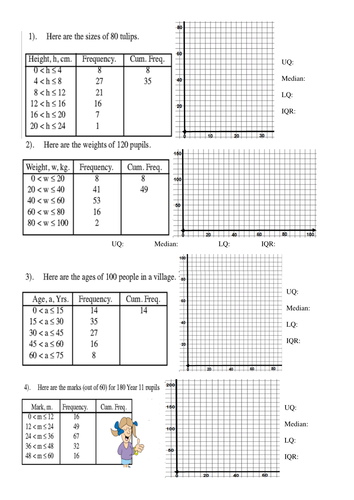
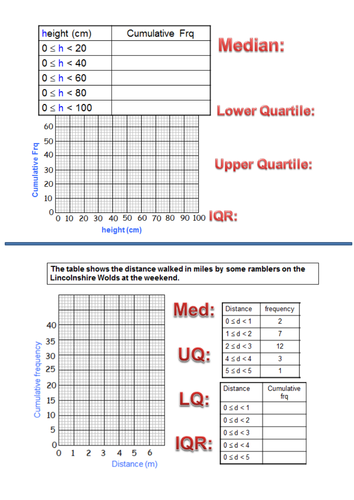
Enough for two lessons. Teaches how to calculate quartiles and the interquartile range to create box plots first. Then goes through two full examples for cumulative frequency diagrams (to be used with worksheet provided) followed by 4 practice questions with answers. Teacher could use this resource to teach the topic without any understanding of Cumulative Frequency.
Something went wrong, please try again later.
This resource hasn't been reviewed yet
To ensure quality for our reviews, only customers who have purchased this resource can review it
Report this resourceto let us know if it violates our terms and conditions.
Our customer service team will review your report and will be in touch.
£5.00