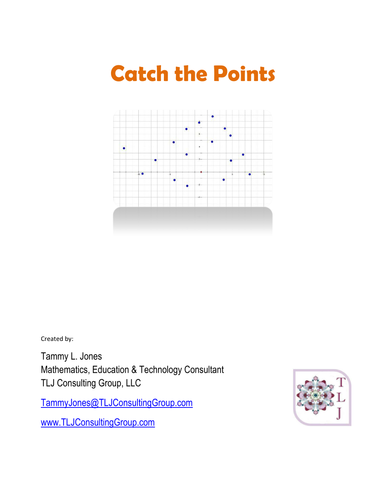


Secondary mathematicians are developing functional fluency in their study of mathematics. One of the primary representations of functions is the graph. Here is a set of ten graphs of points through which students can try to create functions that will “catch” the most points with the graph. Some of the graphs have points that appear to be quadratic in nature, some linear, and some exponential. The type of graph created can depend upon the student, their level, the mathematical topic being studied, or the teacher’s desire.
These make nice journal prompts as well as activities for learning stations. Encourage students to use their graphing technology, TI-Nspire, TI-84 family, etc, as a tool of investigation. Students need to record each of their trials and discuss their thinking as they made refinements to their original function.
This resource is useful for students with Dyslexia and language-based learning deficiencies. We'd like to hear about your experience with our resources. Just give it a star rating then tell us what you think, simple as that!
Something went wrong, please try again later.
This resource hasn't been reviewed yet
To ensure quality for our reviews, only customers who have purchased this resource can review it
Report this resourceto let us know if it violates our terms and conditions.
Our customer service team will review your report and will be in touch.
$3.00