

Presentation and activity showing learners how the CLT works and how it can be used to produce confidence intervals. The initial activity demonstrates how plotting the students samples produces a normal distribution.
Instructions,
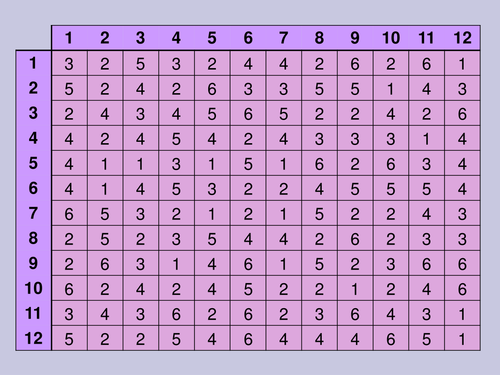
1. Students collect samples of a given size
2. Teacher uses powerpoint to plot students results and discusses results
3. Repeat with bigger sample to show how the results cluster round the mean.
SMART Notebook Express presentations can be used for free by using SMART online or by downloading SMART software, also free, I use it because it allows a more interactive presentation than a powerpoint. Just search 'SMART Notebook Express' and try it with my free SMART resource.
Instructions,
1. Students collect samples of a given size
2. Teacher uses powerpoint to plot students results and discusses results
3. Repeat with bigger sample to show how the results cluster round the mean.
SMART Notebook Express presentations can be used for free by using SMART online or by downloading SMART software, also free, I use it because it allows a more interactive presentation than a powerpoint. Just search 'SMART Notebook Express' and try it with my free SMART resource.
Something went wrong, please try again later.
This resource hasn't been reviewed yet
To ensure quality for our reviews, only customers who have purchased this resource can review it
Report this resourceto let us know if it violates our terms and conditions.
Our customer service team will review your report and will be in touch.
£4.00