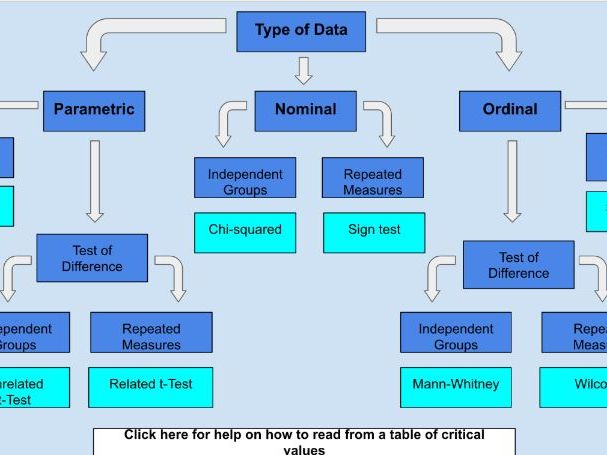
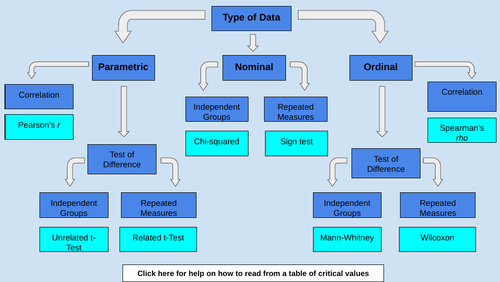
This interactive flowchart helps you decide which statistics test to perform based on the type of data you have and what you are looking for.
If you click on each of the categories it brings up a help bubble with a descriptor of what it means.
If you click on each statistical test it brings up a complete worked example of how to perform that test.
It also includes a help sheet and example questions on reading from a table of critical values.
My students have found this invaluable in helping them navigate which test to use, but also as a visual display to aid their memory.
Something went wrong, please try again later.
This resource hasn't been reviewed yet
To ensure quality for our reviews, only customers who have purchased this resource can review it
Report this resourceto let us know if it violates our terms and conditions.
Our customer service team will review your report and will be in touch.
£5.00