Creating and Interpreting a Dot Plot – Statistics Worksheets | Data Representation & Analysis Practice
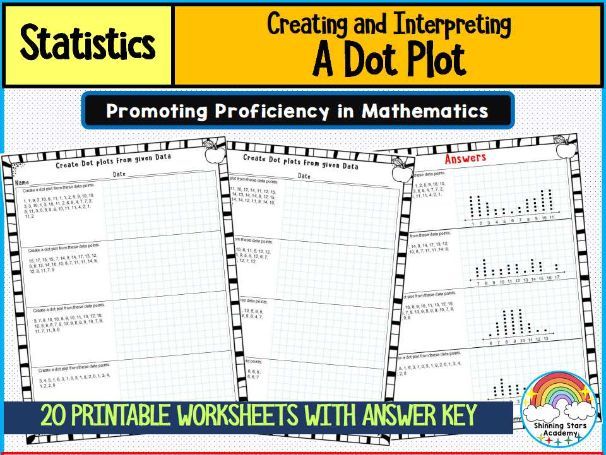
This Creating and Interpreting a Dot Plot Statistics Worksheet set is an engaging and effective resource designed to help students understand how to organize, display, and interpret data using dot plots. Perfect for Grades 6–9, these worksheets guide learners through both the construction and analysis of dot plots, strengthening their grasp of data distribution, variability, and central tendency.
Students will practice plotting numerical data on a number line, identifying clusters, gaps, and outliers, and drawing conclusions about the dataset. The activities progress from simple data sets to more complex real-world examples, ensuring a strong conceptual foundation in descriptive statistics and data interpretation.
Included Topics:
Understanding what a dot plot represents
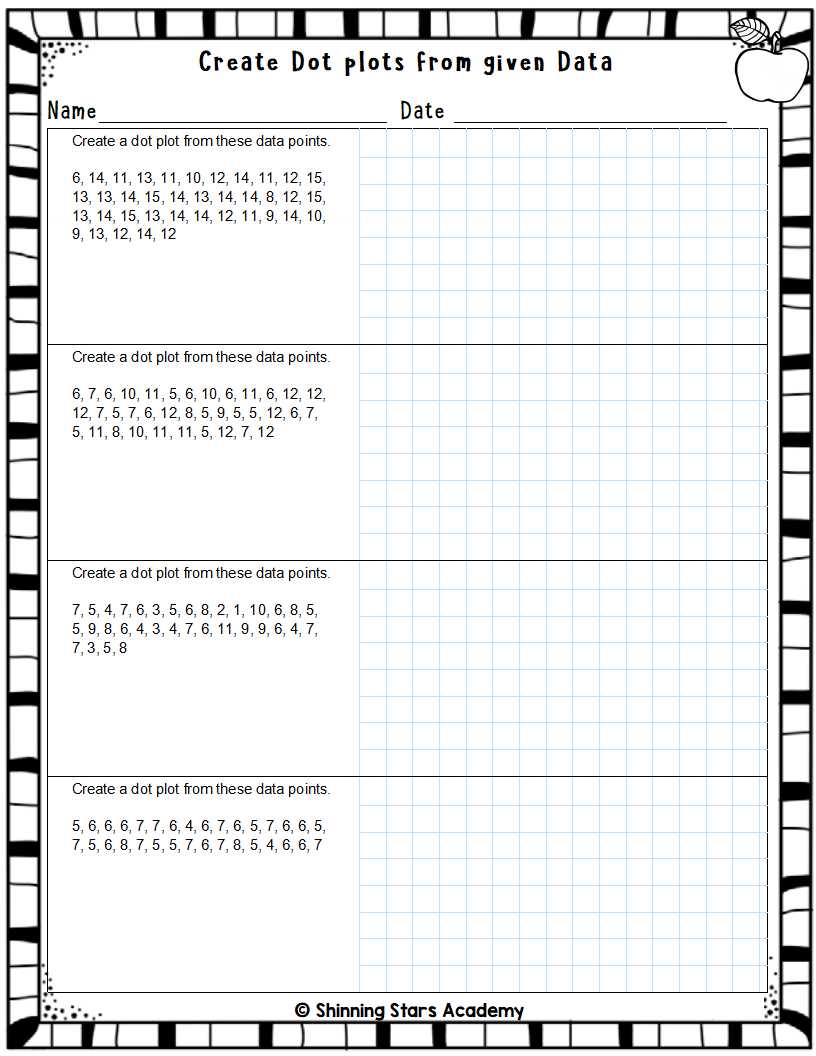
Creating dot plots from raw data sets
Interpreting data using dot plots
Comparing multiple data sets using dot plots
Finding and analyzing the mean, median, mode, and range from dot plots
Identifying patterns, clusters, gaps, and outliers
Real-world applications of dot plots in surveys and statistics
Key Features:
Suitable for Grades 6–9, aligned with Common Core and international math standards
Step-by-step examples and guided practice questions included
Worksheets increase in difficulty and data complexity for differentiated instruction
Designed to build statistical reasoning and visual data literacy
Perfect for classroom lessons, homework, test prep, or math centers
Includes answer keys for quick grading and self-assessment
Available in printable and digital formats for flexible use
Skills Developed:
Representing numerical data using dot plots
Interpreting and comparing data visually
Analyzing variability and data distribution
Applying statistical vocabulary in context
Developing logical reasoning and data analysis confidence
This Dot Plot Statistics Worksheet Pack helps students move beyond simple number crunching—teaching them how to visualize data, identify trends, and make meaningful conclusions. Ideal for teachers seeking high-quality, standards-aligned materials for statistics and data handling units.
Worksheets are made in 8.5” x 11” Standard Letter Size. This resource is helpful in students’ assessment, Independent Studies, group activities, practice and homework. This product is available in PDF format and ready to print as well. AI is used in some parts of the product, where deemed necessary.
Something went wrong, please try again later.
This resource hasn't been reviewed yet
To ensure quality for our reviews, only customers who have purchased this resource can review it
Report this resourceto let us know if it violates our terms and conditions.
Our customer service team will review your report and will be in touch.
$3.50