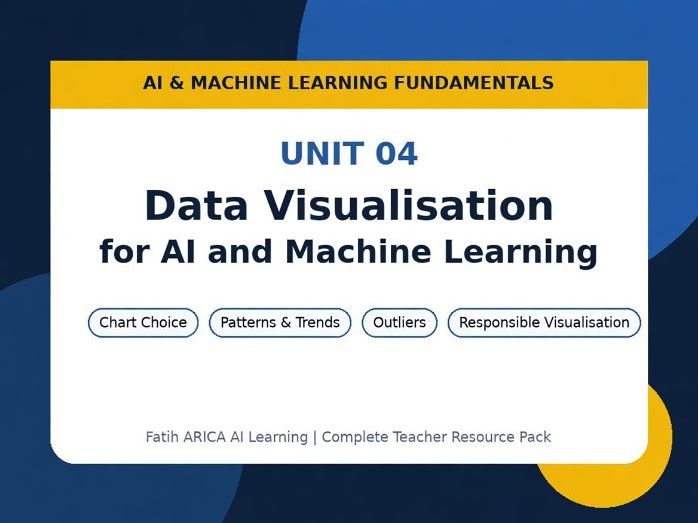


Data Visualisation for AI and Machine Learning – Complete Teacher Resource Pack is a classroom-ready resource from Fatih ARICA AI Learning, designed to help students understand how visualisation supports data inspection, interpretation and responsible AI learning.
This unit shows students that charts are not just decoration. Visualisation can help reveal patterns, problems, relationships, trends and outliers before machine learning models are built.
The core message of the unit is:
Good visualisation helps us see patterns, problems and relationships before we build models.
Across four structured lessons, students explore why visualisation matters, how to choose the right chart, how to identify patterns and outliers, and how charts can mislead viewers if they are poorly designed or interpreted too quickly.
Lesson 1 – Why Data Visualisation Matters
Students learn how charts can support data inspection and make unusual values, comparisons and patterns easier to notice.
Lesson 2 – Choosing the Right Chart
Students match chart types to data questions, including bar charts, line charts, scatter plots, histograms, pie charts and tables.
Lesson 3 – Patterns, Trends and Outliers
Students identify trends, clusters, relationships and outliers, while learning that visual patterns do not automatically prove cause.
Lesson 4 – Clear, Honest and Responsible Visualisation
Students investigate misleading chart features such as cropped axes, missing labels, wrong chart types, cherry-picked data and unsupported conclusions.
This pack includes:
Course Promo Page
Teacher Guide
Teacher Handbook
Student Summary Notes
Student Worksheet
Answer Key
Printable Activity Cards
Exit Tickets
Classroom Slides
Editable DOCX files
Read Me First guide
TES cover image
Students will learn to choose suitable charts, interpret visual patterns carefully, recognise misleading charts, explain why axes and labels matter, and communicate data clearly and responsibly.
This resource is suitable for introductory AI lessons, machine learning foundations, data literacy, data visualisation, secondary computing, digital technology and beginner data science lessons.
It can be taught with live charting, teacher demonstration, printed chart examples or no-code classroom discussion.
Suggested duration: 4 × 40-minute lessons.
Part of the Fatih ARICA AI Learning classroom resource series. Related AI & Machine Learning books will also be available separately.
Something went wrong, please try again later.
This resource hasn't been reviewed yet
To ensure quality for our reviews, only customers who have purchased this resource can review it
Report this resourceto let us know if it violates our terms and conditions.
Our customer service team will review your report and will be in touch.
£3.00