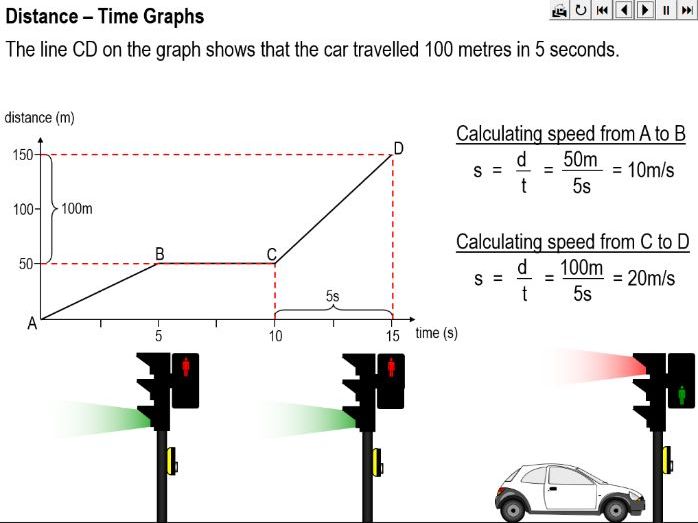


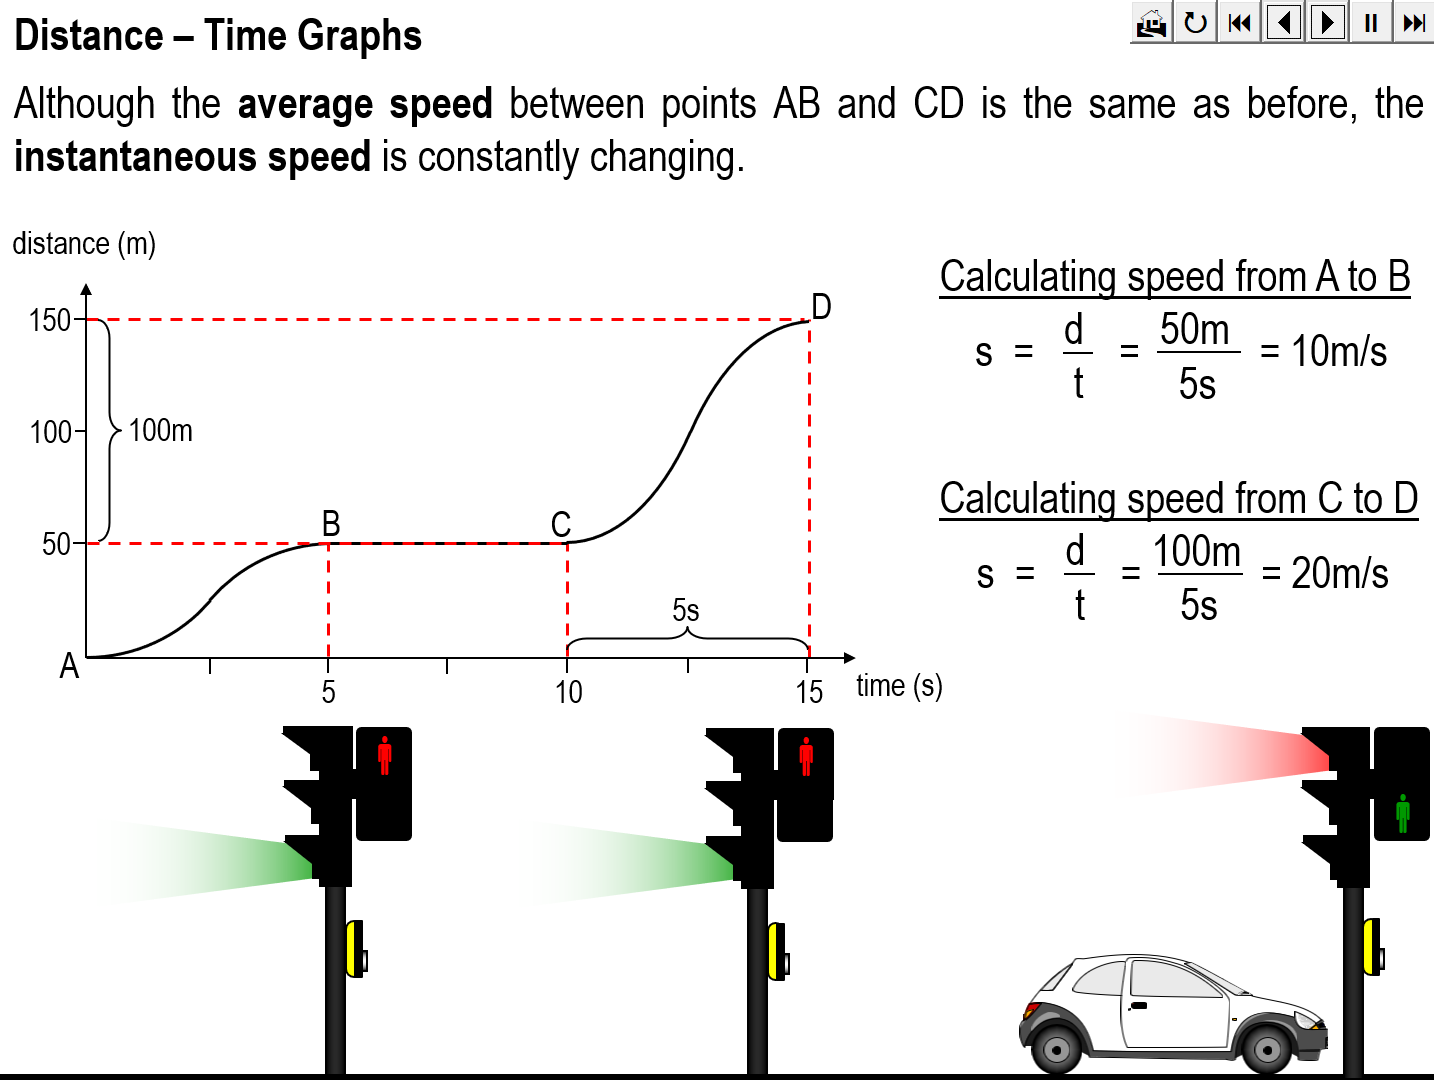


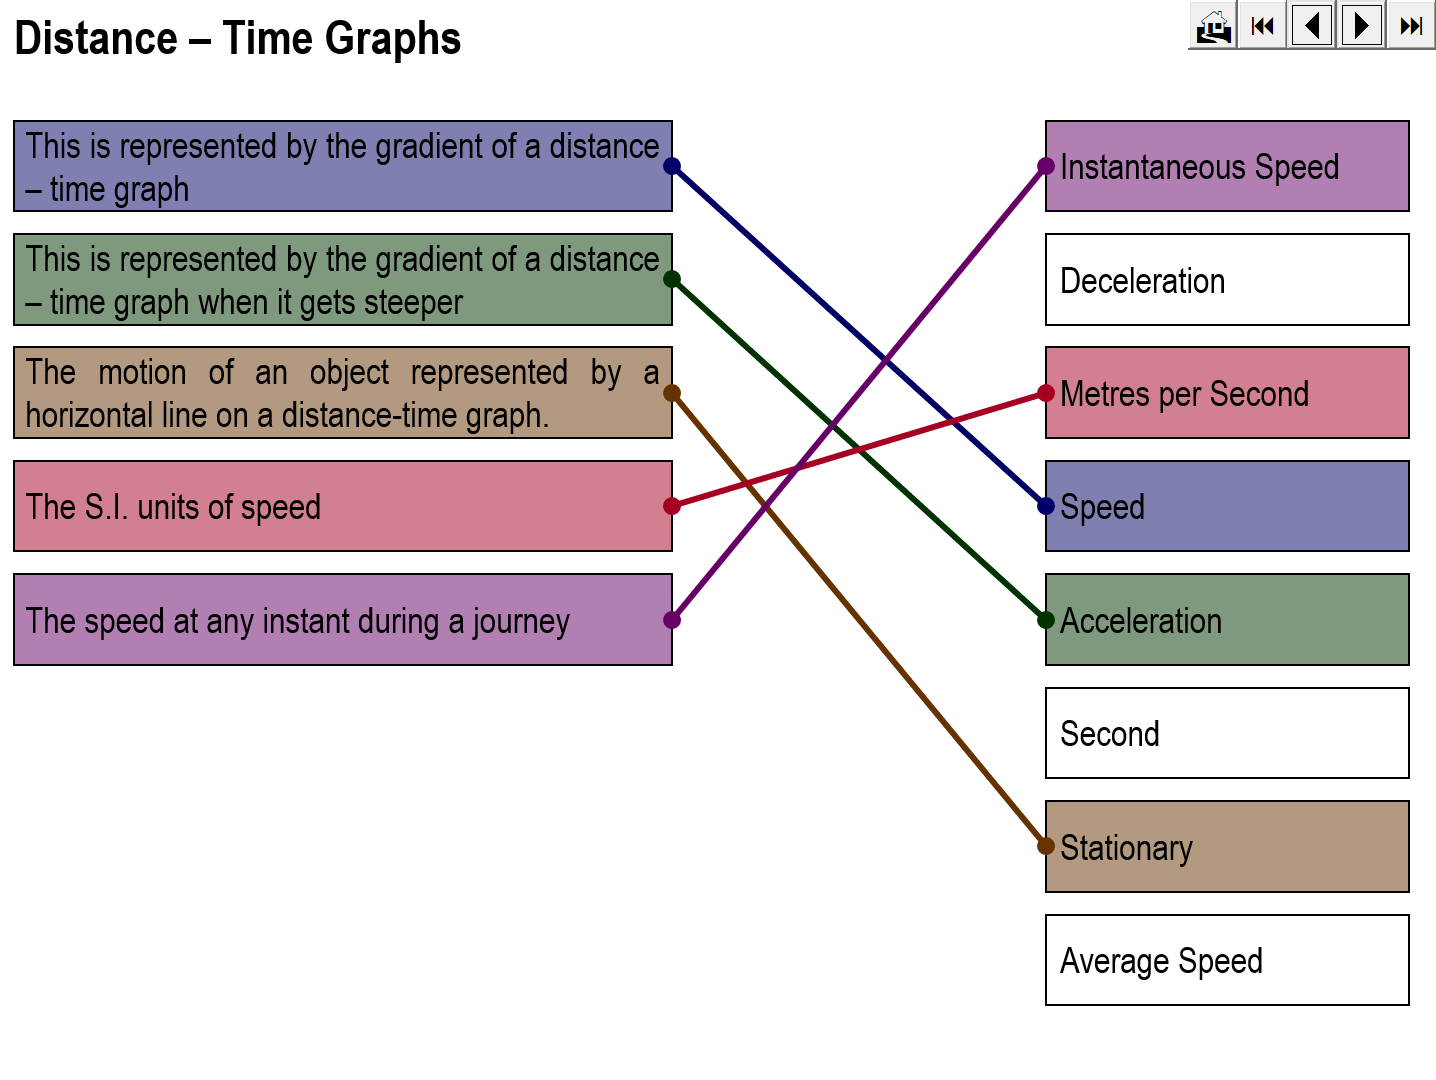
An animation illustrating how uniform and non-uniform speed can be represented graphically. It also explains the difference between average speed and instantaneous speed.
I have many others of the same format; these can be seen by visiting my shop on the TES website (search: rtyler62).
If you buy this resource, please print the Readme document as it contains the instructions and details of the files included.
NOTE: MACROS MUST BE ENABLED FOR ALL POWERPOINT PRESENTATIONS
Support Material
- Readme (instructions for whole lesson)
- Learning outcomes (PowerPoint)
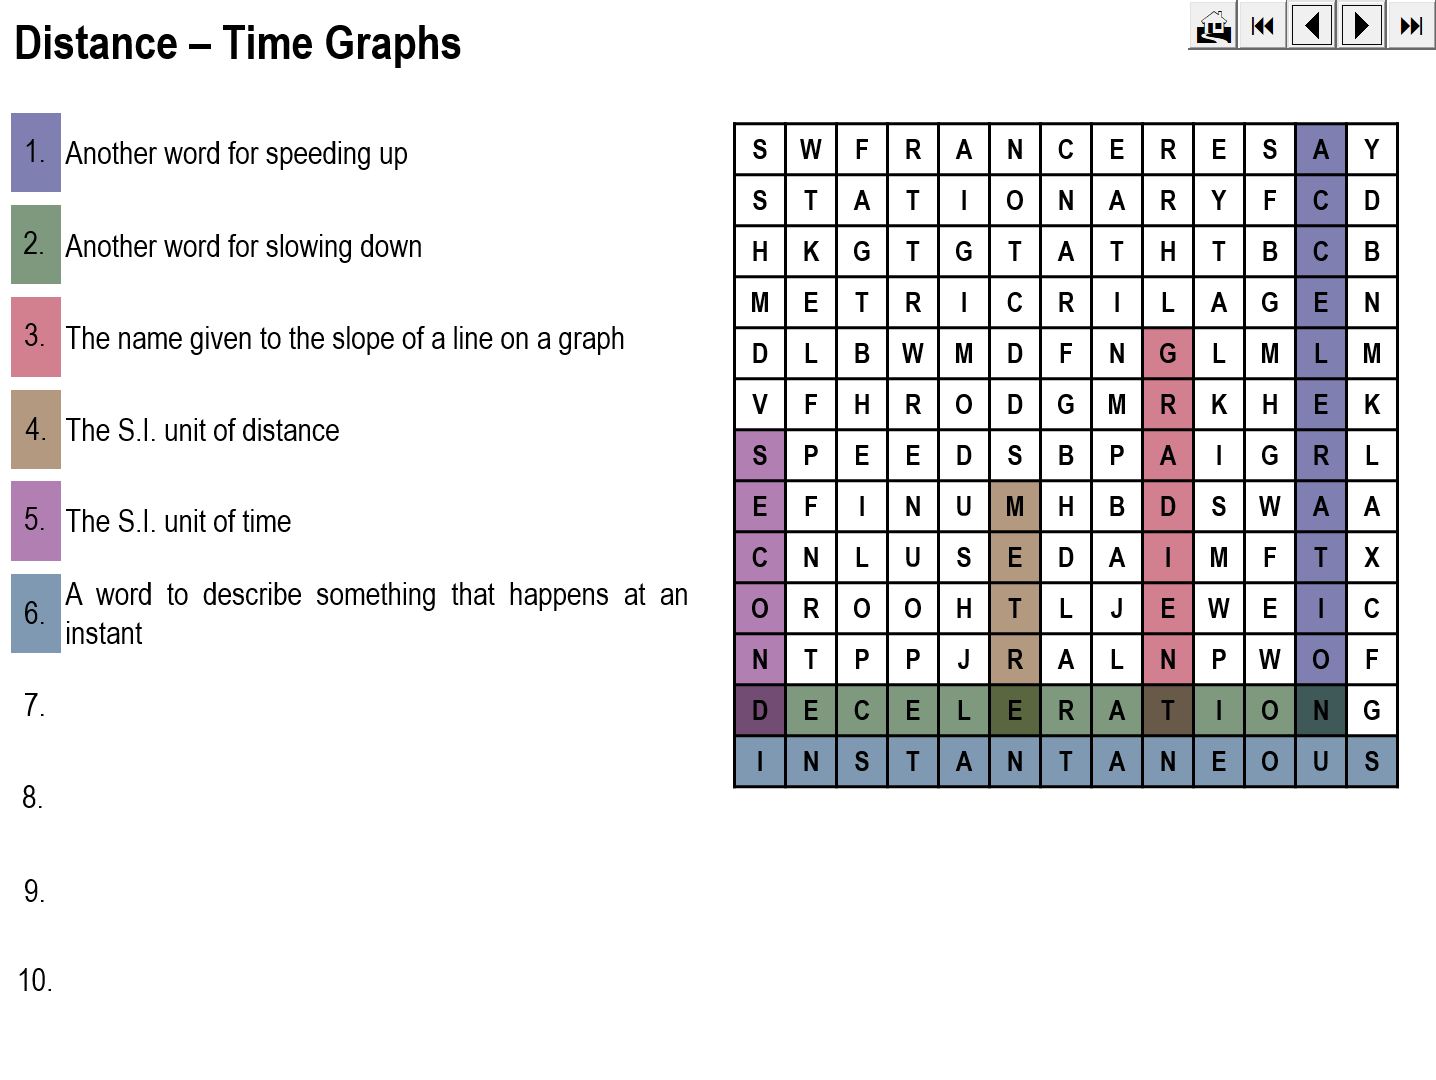
- Starter activity (PowerPoint and worksheet)
- Main activity (PowerPoint presentation)
- Assessment (worksheets with answer sheets - differentiated)
- Lesson notes (handout – 2 x A5 on A4 paper)
- Plenary activity (PowerPoint and worksheet)
Users and Timings
It is intended for all science teachers but particularly those who are not physics specialists and is, primarily, aimed at 14 to 16 year old pupils. Normally, the activities would fill a 45 to 60 minute lesson.
Learning Outcomes
The learning outcomes are based on Bloom’s taxonomy of hierarchical classification: knowledge, comprehension, application, analysis, synthesis and evaluation. The lesson title and learning outcomes are:
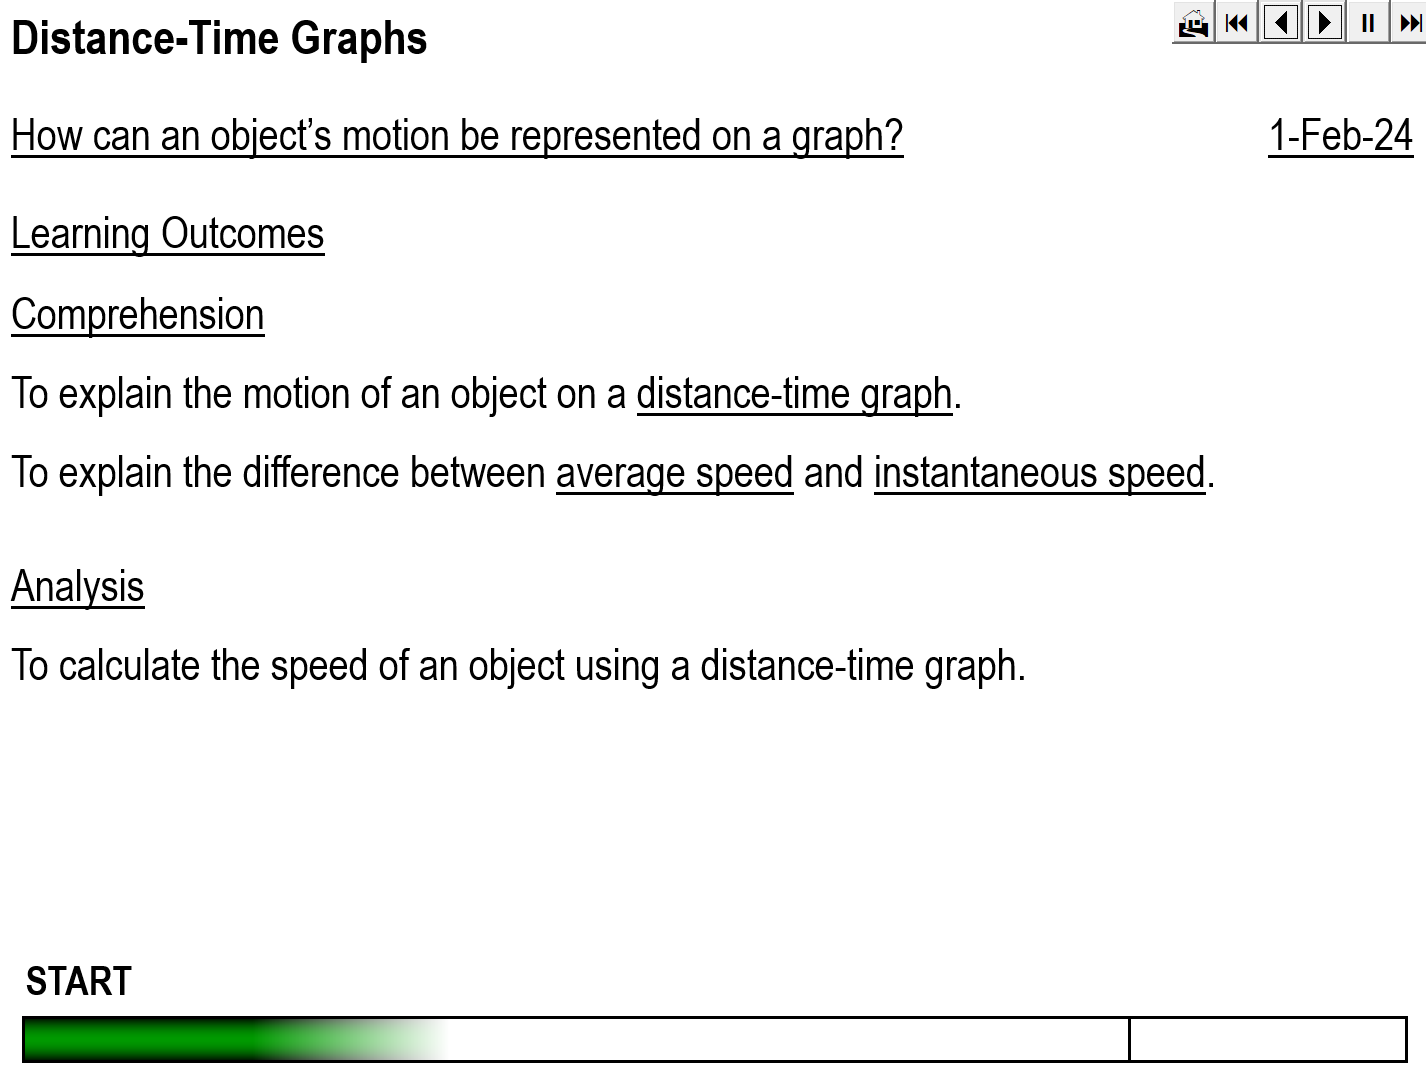
How can an object’s motion be represented on a graph?
Learning Outcomes
Comprehension
To explain the motion of an object on a distance-time graph.
To explain the difference between average speed and instantaneous speed.
Analysis
To calculate the speed of an object using a distance-time graph.
Differentiation
The activities have varying degrees of differentiation; please refer to the Readme document.
Something went wrong, please try again later.
This resource hasn't been reviewed yet
To ensure quality for our reviews, only customers who have purchased this resource can review it
Report this resourceto let us know if it violates our terms and conditions.
Our customer service team will review your report and will be in touch.
£4.00