


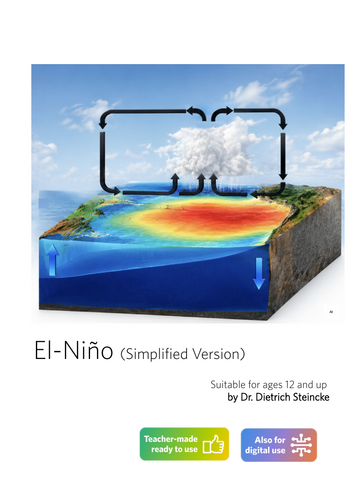
Explore the fascinating weather phenomenon known as El Niño with your students! It is ready for immediate use in your classroom.
What can you and your students expect?
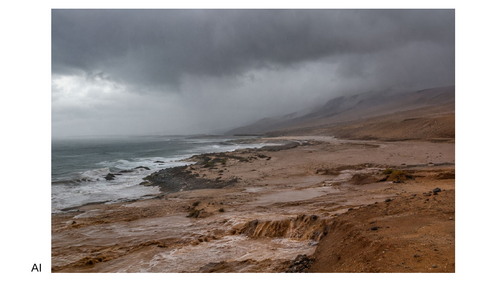
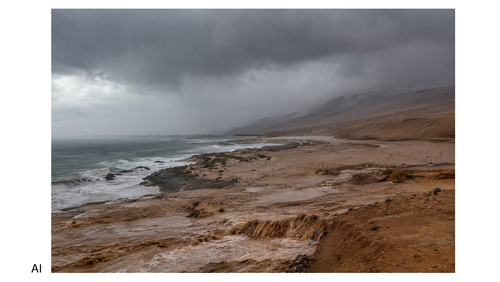
An engaging introduction: Kick off the lesson with a visual prompt (Slide 1). Have your students describe the image and consider what makes it unusual - for instance, they might notice heavy rainfall in a coastal landscape that is typically desert-like.
Open-ended questions and prior knowledge: Pose open-ended questions about how this weather event might come to be. You can also discuss potential links to climate change, even though El Niño is a natural phenomenon. Together, revisit existing knowledge regarding climatic factors such as solar radiation, winds, and ocean currents.
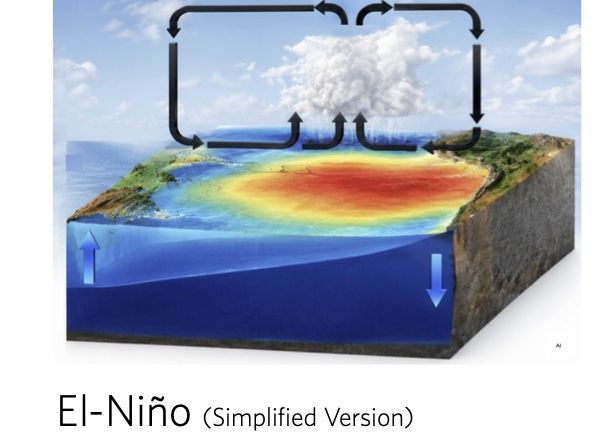
Map work and analysis: On Slide 2, students orient themselves using a map, identifying key regions like Australia, Indonesia, South America, and the Pacific Ocean. They then interpret the color-coding on the water, which represents deviations in sea surface temperature. The red and blue areas on the map indicate where the seawater is unusually warm or cold - a hallmark of El Niño.
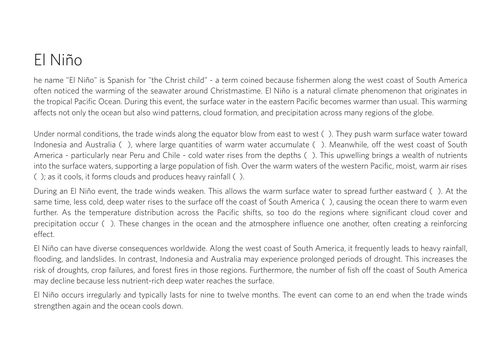
Comprehensive worksheets: Two worksheets help deepen the students’ understanding. The first provides textual information about El Niño, while the second features illustrations comparing “normal” conditions with those during an El Niño event. Students fill in missing figures in the text by referring to the projected visuals (Slides 3 and 4). An answer key is provided to assist with grading.
Reasoning and evidence: Using the text, students must provide evidence to determine which side of the Pacific Ocean the weather event took place on. They also illustrate what a scene in Indonesia or Australia might look like during an El Niño event - for example, typically lush vegetation suffering under heat and drought conditions.
Differentiation for advanced learners: There is an additional task for more advanced students. They are asked to research the most recent El Niño event (2026/27) and compare it with the situation in 1997/98, synthesizing their findings into a coherent, continuous text.
Optimized presentation: The materials include a presentation designed for optimal use on tablets and iPads. It features a full-color, landscape-oriented layout.
Something went wrong, please try again later.
This resource hasn't been reviewed yet
To ensure quality for our reviews, only customers who have purchased this resource can review it
Report this resourceto let us know if it violates our terms and conditions.
Our customer service team will review your report and will be in touch.
£3.99