

We have included two versions of a correlation activity for use in the classroom.
-
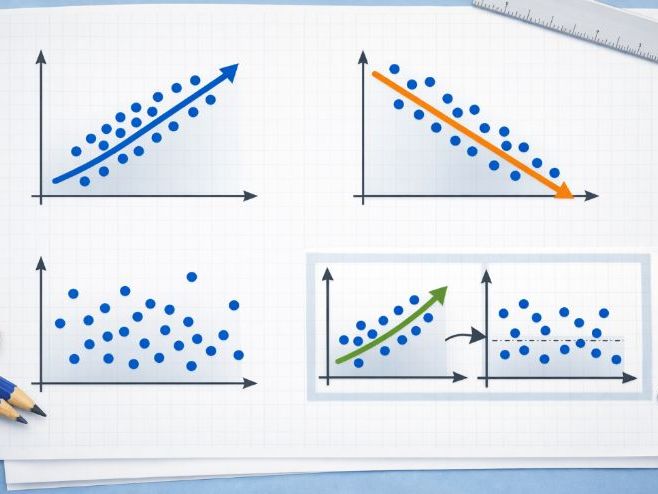
Scatter Graphs - These can be used as a sorting activity where you could have them judge correlation from weakest to strongest, or strongest negative through to strongest positive. Alternatively, they can be used as a teaching aid for determining lines of best fit.
-
Data Sets - These can be used to produce the scatter graphs for the same activities as above, providing learners with graph drawing practice.
This is a sample of the workshops and resources we have available as part of our outreach program at Aberystwyth University for the Faculty of Science.
For more information please visit:
https://outreach-hub.aber.ac.uk
Something went wrong, please try again later.
This resource hasn't been reviewed yet
To ensure quality for our reviews, only customers who have downloaded this resource can review it
Report this resourceto let us know if it violates our terms and conditions.
Our customer service team will review your report and will be in touch.
£0.00