


IB Maths AI 4.4 – Correlation and Regression Notes
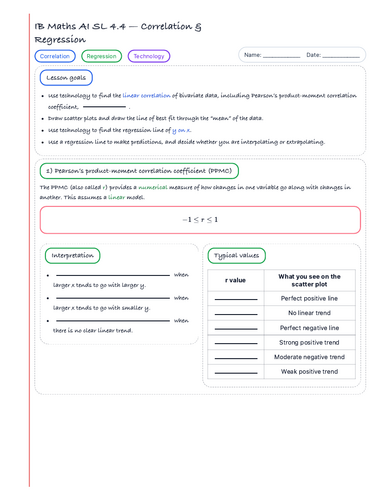
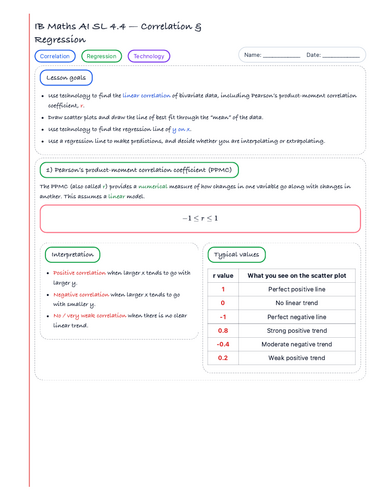
Develop students’ understanding of bivariate data with these structured notes for IB Mathematics: Applications and Interpretation SL Topic 4.4. The resource connects scatter plots, correlation coefficients, and linear regression to interpretation and prediction in context.
Topics covered- Interpreting scatter plots and describing the strength and direction of relationships.
- Pearson’s product-moment correlation coefficient and Spearman’s rank correlation coefficient.
- Calculating and interpreting correlation coefficients using technology.
- Finding and interpreting the regression line of y on x.
- Using regression models for prediction and distinguishing interpolation from extrapolation.
The student copy includes guided technology practice and exam-style interpretation questions. The teacher copy provides completed solutions, model answers, and contextual explanations. Use for guided instruction, independent study, or review.
Pair these notes with the IB Math AI SL 4.4 Correlation & Regression slide deck and IB Math AI Worksheet SL 4.4 Correlation & Regression for explanations and scaffolded practice.
Get this resource as part of a bundle and save up to 58%
A bundle is a package of resources grouped together to teach a particular topic, or a series of lessons, in one place.
Something went wrong, please try again later.
This resource hasn't been reviewed yet
To ensure quality for our reviews, only customers who have downloaded this resource can review it
Report this resourceto let us know if it violates our terms and conditions.
Our customer service team will review your report and will be in touch.
£0.00