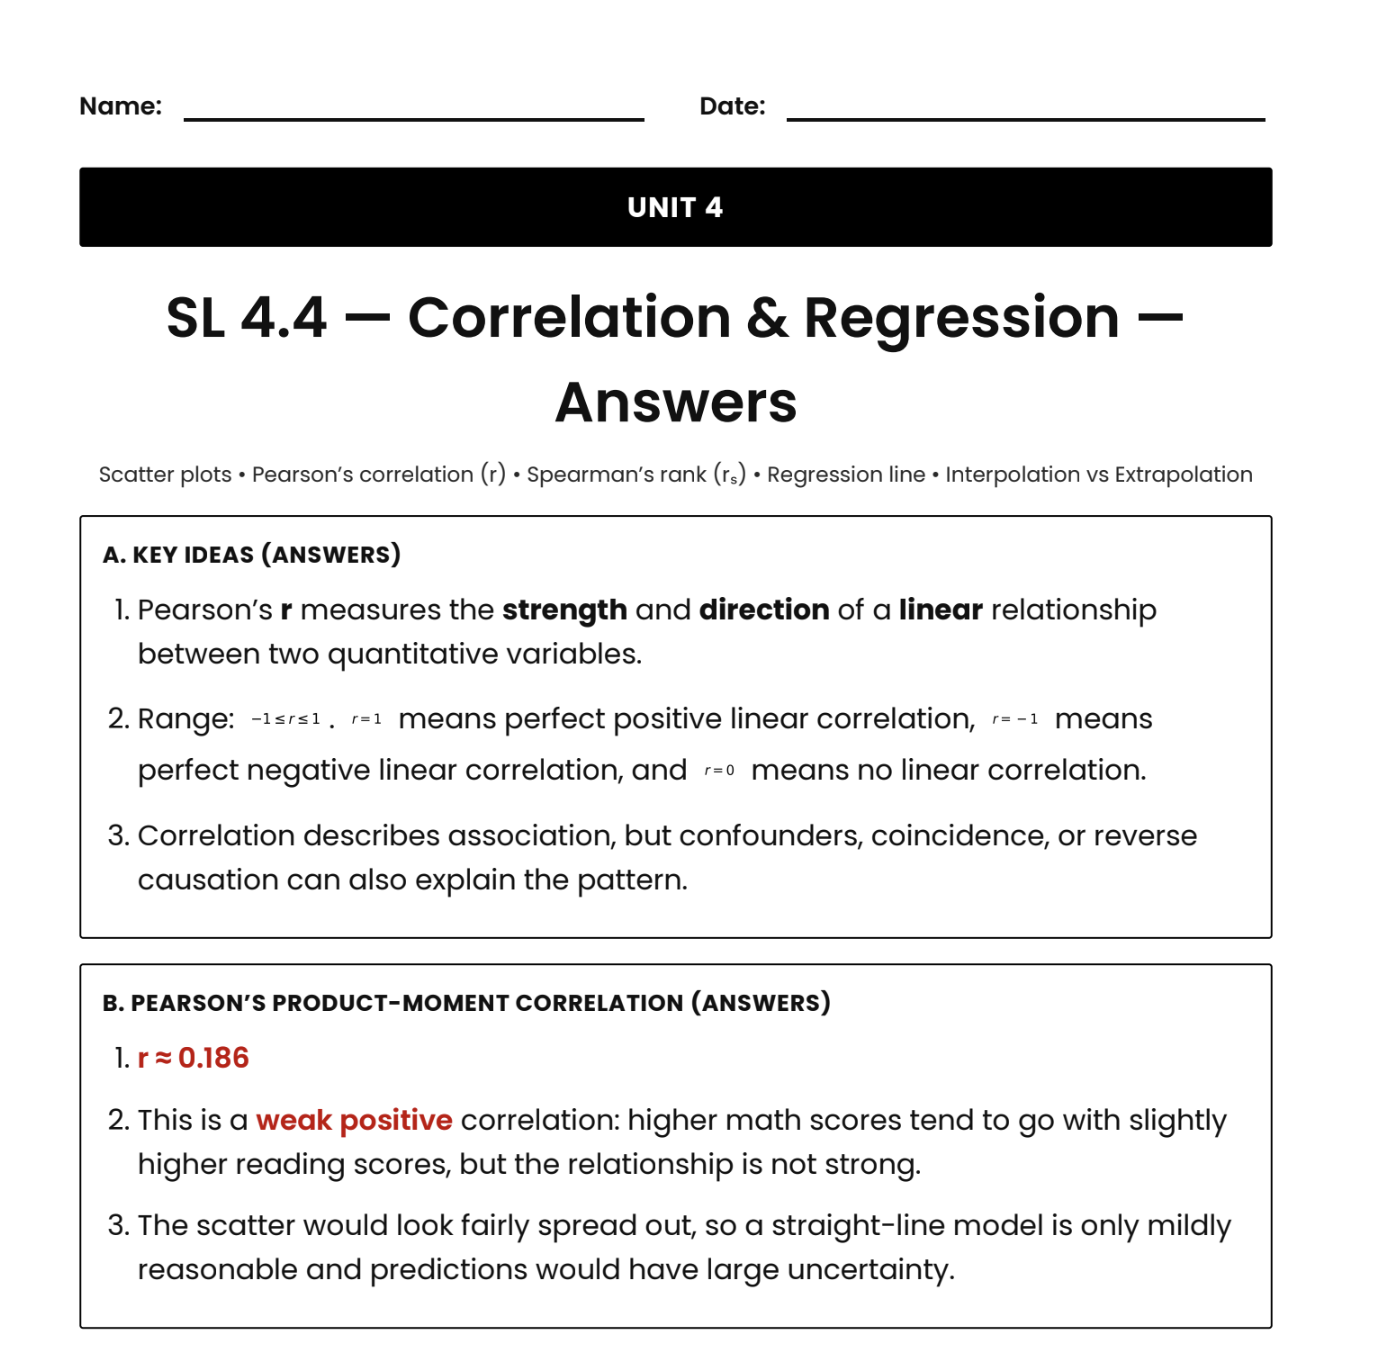
This IB Math AI SL 4.4 – Correlation & Regression resource develops students’ understanding of how relationships between two variables are analysed, interpreted, and used for prediction. The lesson builds conceptual clarity around scatter plots and correlation, focusing on how Pearson’s correlation coefficient measures the strength and direction of a linear relationship and why correlation does not imply causation .
Students use technology to calculate Pearson’s ® and Spearman’s rank correlation (r_s), comparing linear and monotonic relationships and interpreting results in context. The resource then extends to least-squares linear regression, guiding students in interpreting the gradient and intercept of a regression line and using models for prediction while distinguishing between interpolation and extrapolation .
Structured tasks combine calculation, graph interpretation, ranking methods, and modelling questions, reinforcing both conceptual understanding and IB-required technology skills. With scaffolded exercises, real data contexts, and a full answer key, this resource supports SL-level classroom instruction and independent study while strengthening students’ ability to analyse bivariate data in line with IB Mathematics AI expectations .
Get this resource as part of a bundle and save up to 30%
A bundle is a package of resources grouped together to teach a particular topic, or a series of lessons, in one place.
Something went wrong, please try again later.
This resource hasn't been reviewed yet
To ensure quality for our reviews, only customers who have purchased this resource can review it
Report this resourceto let us know if it violates our terms and conditions.
Our customer service team will review your report and will be in touch.
£3.00