

IB Math AI SL 2.3 – Graphing Functions
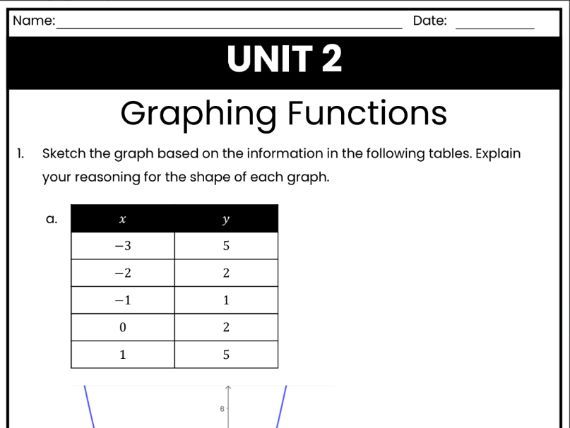
This printable and editable worksheet gives students structured practice in graphing a variety of functions and interpreting their features. Beginning with simple data tables, students learn to identify function types from patterns, such as linear, quadratic, absolute value, and radical, and to explain the reasoning behind each graph’s shape.
Through step-by-step exercises, students graph linear, quadratic, exponential, and rational functions using suitable domains and calculate key characteristics such as intercepts, vertices, and points of intersection. The final sections introduce composite and combined functions, where learners sketch h(x) = f(g(x)) and interpret how adding or subtracting functions affects their graphs.
Aligned with the IB Math AI SL Topic 2.3 syllabus, this worksheet is ideal for classroom instruction, homework, or revision, strengthening students’ ability to connect algebraic rules to visual representations and analyze relationships between multiple functions.
Get this resource as part of a bundle and save up to 33%
A bundle is a package of resources grouped together to teach a particular topic, or a series of lessons, in one place.
Something went wrong, please try again later.
This resource hasn't been reviewed yet
To ensure quality for our reviews, only customers who have purchased this resource can review it
Report this resourceto let us know if it violates our terms and conditions.
Our customer service team will review your report and will be in touch.
£3.00