

LESSON COVERS:
The environmental impacts of development (rapid urbanisation, deforestation, oil extraction) juxtaposed against the improvements in quality of life.
LESSON INVOLVES:
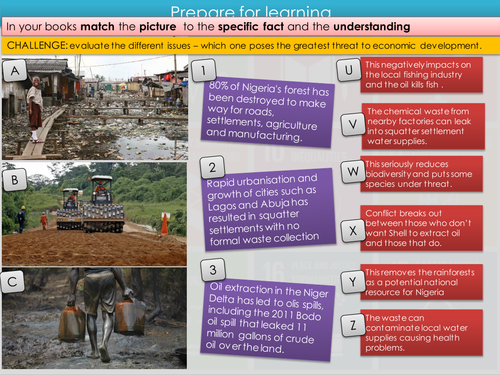
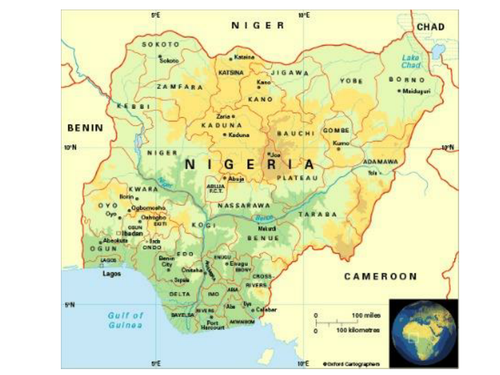
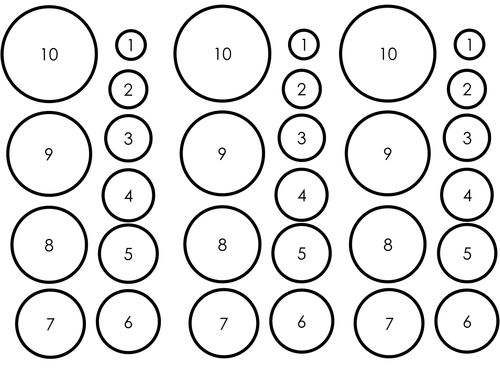
Students start off by matching images to facts and then to explanations of the environmental issue identified above. They then annotate these images with what they have learned. They then add sketches/doodles to a sketch of a Nigerian person to outline their improvements in quality of life. The final task is to create a proportional symbols map to demonstrate the impacts vs. improvement, leading the students to make a judgement over whether the development is actually worth it.
RESOURCES:
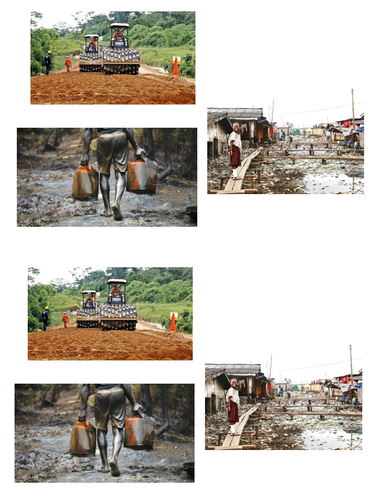
There is the picture to cut out and annotate, as well as the template of a person to trace (or print and cut out). There is also a map of Nigeria for their proportional symbols task, and the proportional symbols to either cut out or trace.
IMPORTANT: For one of the tasks the challenge extension and additional (but not crucial) support material refers to the Oxford GCSE Geography text book (blue cover) if you don’t use this these elements can be deleted or changed.
The lesson also includes a 5 minute “Review Previous Learning” task, as a revision tool - feel free to omit or adapt.
Please review with any feedback or if you spot any weevils in the lesson :-)
Something went wrong, please try again later.
This resource hasn't been reviewed yet
To ensure quality for our reviews, only customers who have purchased this resource can review it
Report this resourceto let us know if it violates our terms and conditions.
Our customer service team will review your report and will be in touch.
£3.00