
Handling data, frequency tables and graphs (four days).
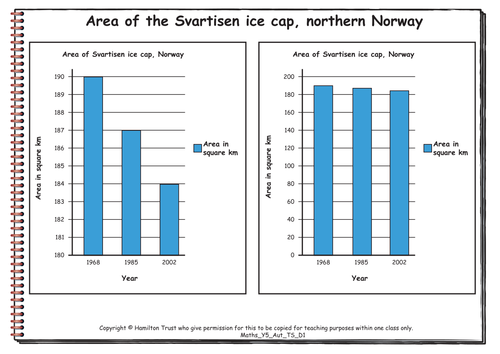
Children discuss the effects of scale on bar graphs and choose their own intervals when constructing them. They construct frequency tables and bar line charts. They learn that the tops of bar line charts can be joined together to form line graphs, for example to show changes over time. They ask and answer question about graphs, including about intermediate points on line graphs.
Find additional lesson plans and resources at www.hamilton-trust.org.uk.
Something went wrong, please try again later.
Decent plans and resources - probably more efficient to search Hamilton site if you like the look of these.
Report this resourceto let us know if it violates our terms and conditions.
Our customer service team will review your report and will be in touch.
£0.00