


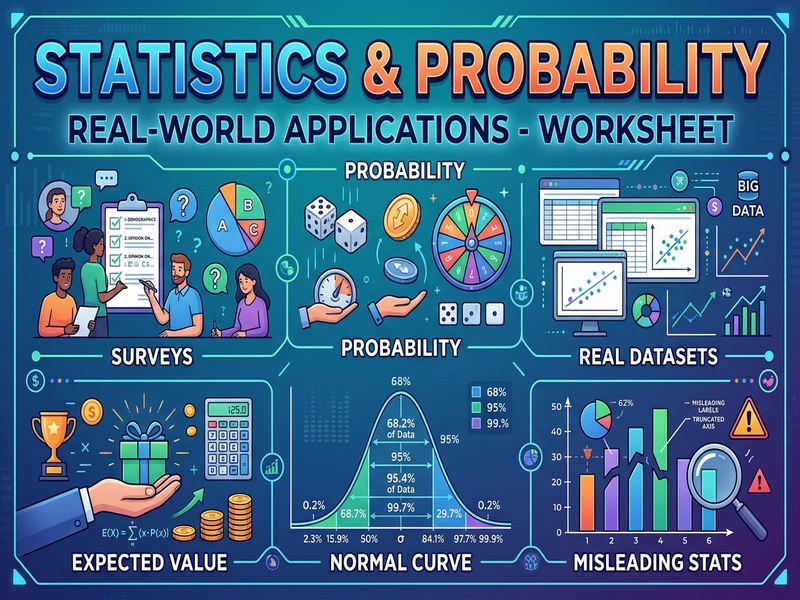
Transform how your students understand data, chance, and media claims with the ultimate Statistics & Probability Real-World Complete Unit & Student Workbook!
Are your students tired of memorizing abstract math formulas without knowing how they apply to real life? This comprehensive, 56-page no-prep resource bridges the gap between textbook mathematics and authentic, real-world decision-making. Designed for Middle and High School Math (Grades 6–12), this modular curriculum takes students step-by-step from foundational data collection to advanced statistical reasoning.
Whether you are teaching High School Statistics, Algebra I & II, Financial Literacy, Pre-Algebra, or Quantitative Reasoning, this all-in-one bundle provides crystal-clear textbook-style readings, real-world case studies, 9 scaffolded practice worksheets (90 total problems!), visual anchor charts, a pacing guide, and a complete step-by-step teacher answer key.
WHAT’S INCLUDED IN THIS 56-PAGE RESOURCE:
PART 1: Comprehensive Instructional Text & Real-World Case Studies (Pages 1–19)
Chapter 1: Surveys & Sampling – Populations vs. samples, selection bias, response bias, non-response bias, Simple Random Sampling (SRS), Stratified, Cluster, and Convenience sampling, plus a Local Community Survey Case Study.
Chapter 2: Probability & Expected Value – Sample spaces, basic & compound probability (independent vs. dependent events), Expected Value (EVEV) formula, tech startup investment analysis, and a Charity Raffle Financial Case Study.
Chapter 3: The Normal Curve & Real Datasets – Mean, median, mode, range, standard deviation (σσ), properties of the Bell Curve, the 68–95–99.7 Empirical Rule, real dataset analysis (50 student heights), and a 20-Year Monthly Rainfall Case Study.
Chapter 4: Misleading Statistics & Critical Thinking – Truncated Y-axes, inconsistent X-axis intervals, cherry-picking data, mean vs. median salary distortions, correlation vs. causation, confounding variables, and Deconstructing a Political Advertisement.
PART 2: 9 Scaffolded Student Worksheets + Formula Reference Guide (Pages 20–40)
Includes a Student Progress Tracker, Quick-Reference Formula Sheet, and 90 applied problems:
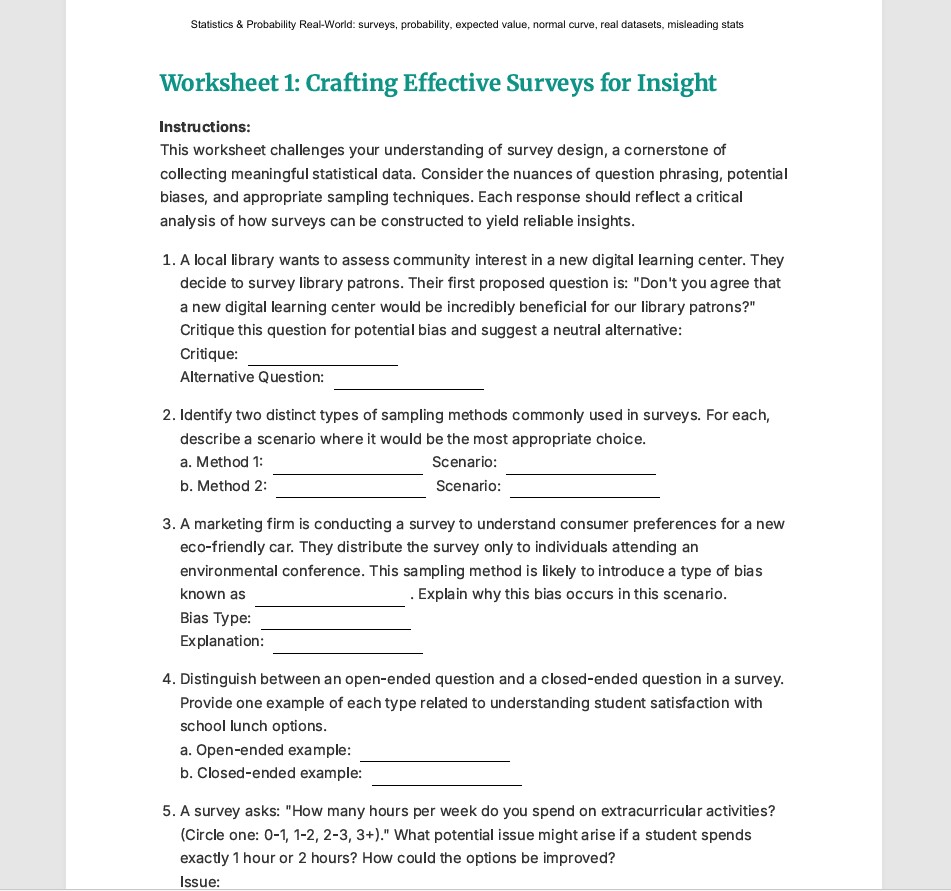
Worksheet 1: Crafting Effective Surveys for Insight (Sampling & Bias)
Worksheet 2: Interpreting & Representing Real-World Survey Data (Tables, Graphs, Central Tendency)
Worksheet 3: Introduction to Probability in Real-World Scenarios (Theoretical vs. Empirical)
Worksheet 4: Compound & Conditional Probability Challenges (Addition Rule, Dependent Events, Bayes’ Theorem)
Worksheet 5: Understanding Expected Value: Decisions & Risks (Games, Raffles & Insurance)
Worksheet 6: Expected Value in Games and Investments (Venture Capital, R&D, Lotteries & Utility)
Worksheet 7: Unpacking the Normal Curve: From Heights to Test Scores (Bell Curve & Empirical Rule)
Worksheet 8: Applying the Normal Curve: Percentiles and Z-Scores (Standardizing Data)
Something went wrong, please try again later.
This resource hasn't been reviewed yet
To ensure quality for our reviews, only customers who have purchased this resource can review it
Report this resourceto let us know if it violates our terms and conditions.
Our customer service team will review your report and will be in touch.
£35.79