


Year 7 Maths Unit 1: Analysing and displaying data – Complete Unit (9 Lessons, Worksheets & Answers)
SHORT SUMMARY (resource summary box)
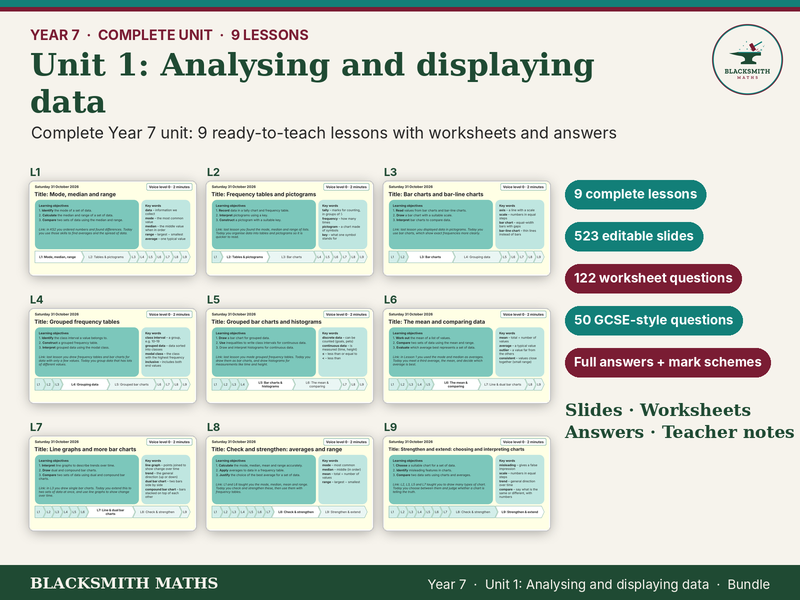
The complete Year 7 Unit 1 Analysing and displaying data: 9 fully editable lessons (523 teaching slides), 9 differentiated worksheets (122 questions), 50 GCSE-style exam questions with mark schemes, and full answers.
DESCRIPTION
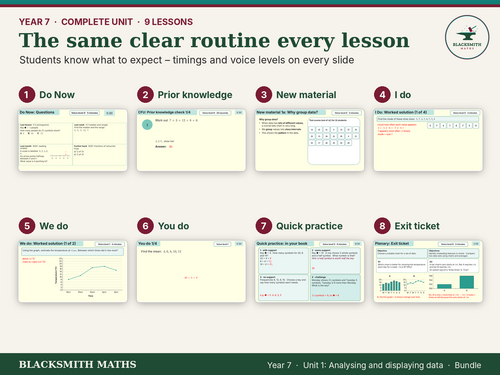
Everything you need to teach Year 7 Unit 1 Analysing and displaying data, from mode, median and range through to histograms and misleading graphs. Every lesson follows the same clear routine, so students know what to expect and cover teachers can pick it up straight away.
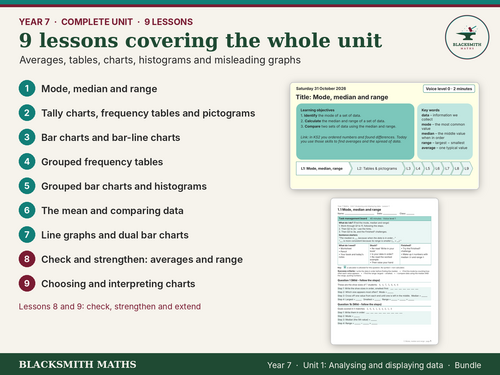
The 9 lessons
• Lesson 1: Mode, median and range
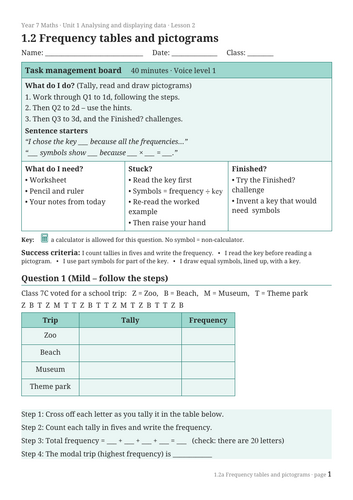
• Lesson 2: Tally charts, frequency tables and pictograms
• Lesson 3: Bar charts and bar-line charts
• Lesson 4: Grouped frequency tables
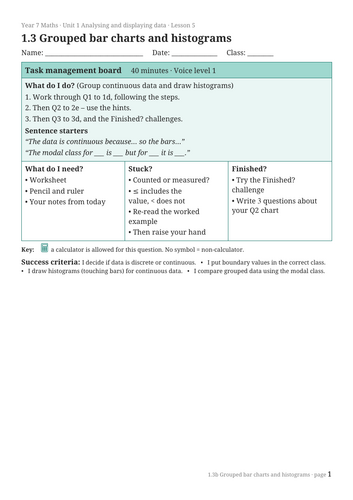
• Lesson 5: Grouped bar charts and histograms
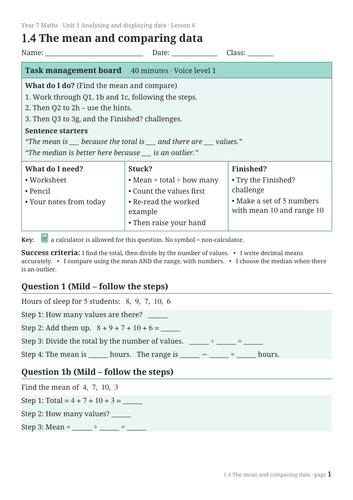
• Lesson 6: The mean and comparing data
• Lesson 7: Line graphs and dual bar charts
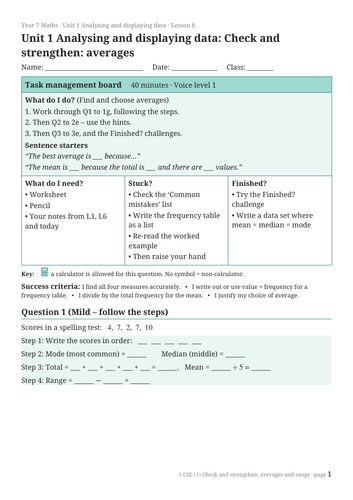
• Lesson 8: Check and strengthen: averages and range
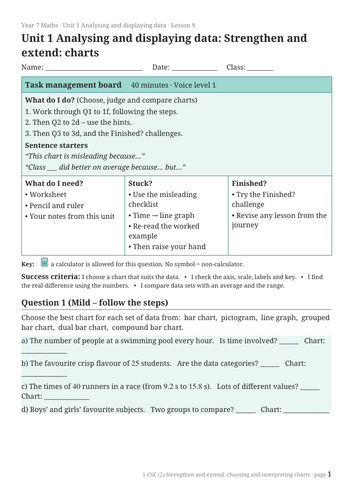
• Lesson 9: Choosing and interpreting charts
In every lesson
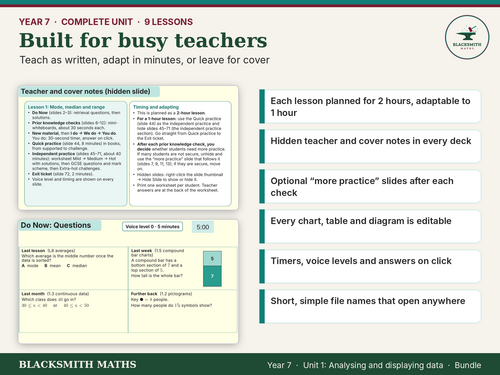
• A PowerPoint with timings and voice levels on every slide, a hidden teacher and cover notes slide, and optional “more practice” slides
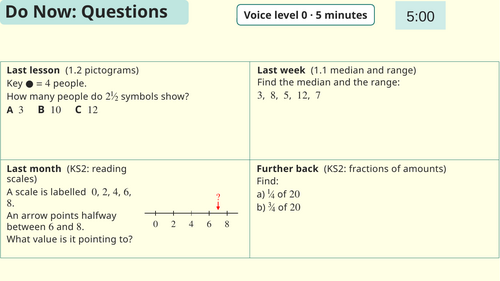
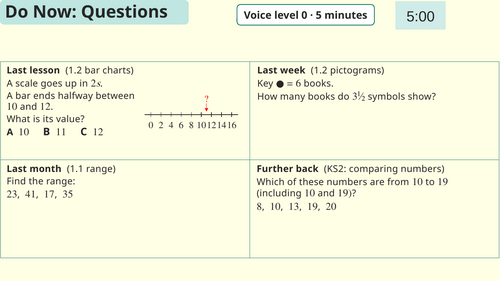
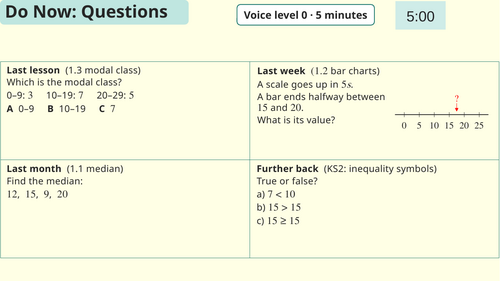
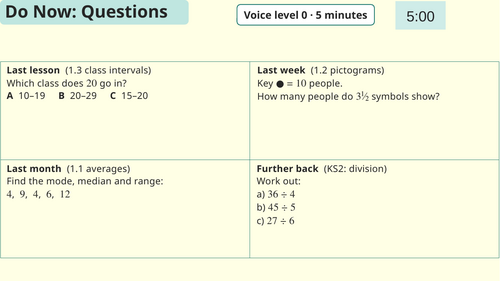
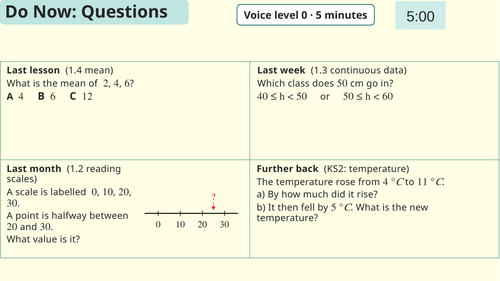
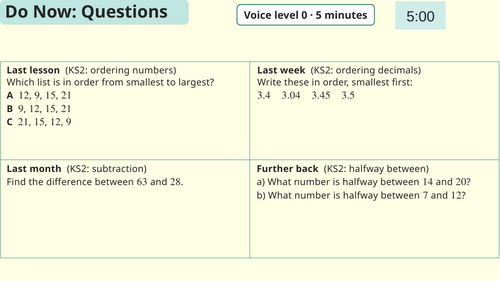
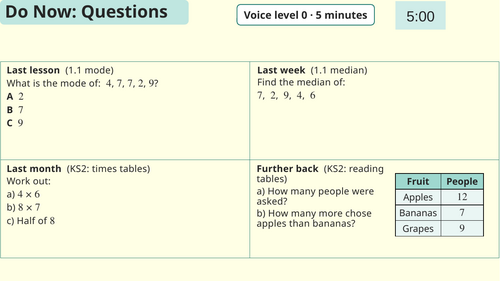
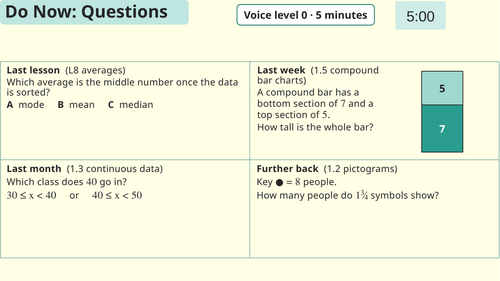
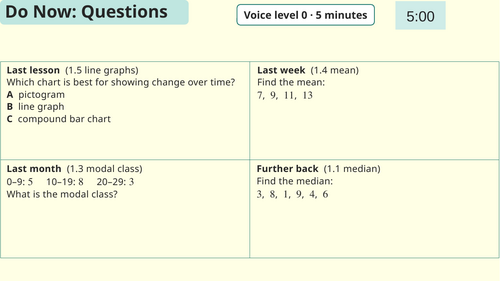
• Do Now (four retrieval questions) and prior knowledge checks for mini-whiteboards, with answers on click
• New material followed by I do → We do → You do for each key idea
• Quick practice in books, from supported to challenge
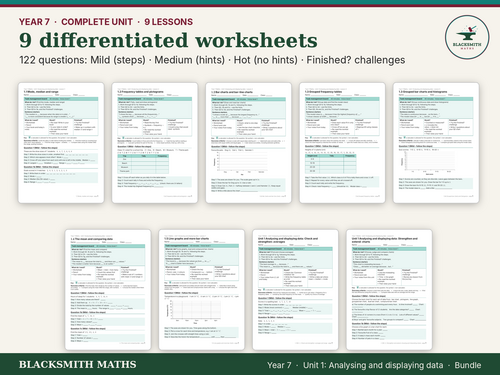
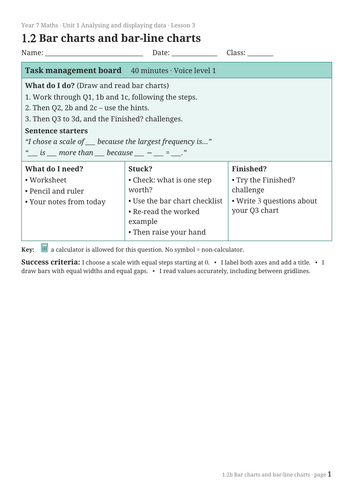
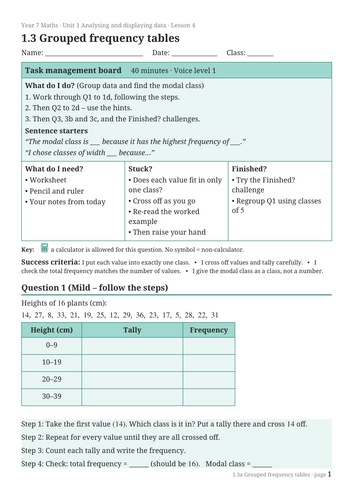
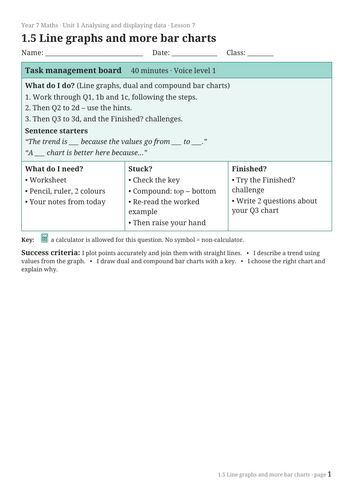
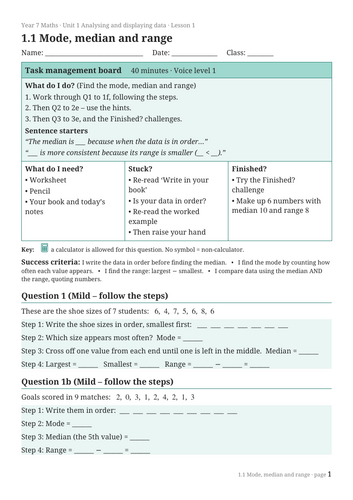
• A differentiated Word worksheet: Mild (step-by-step), Medium (hints), Hot (no hints) and Finished? extension challenges
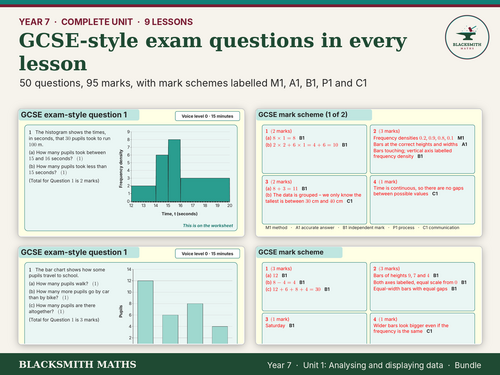
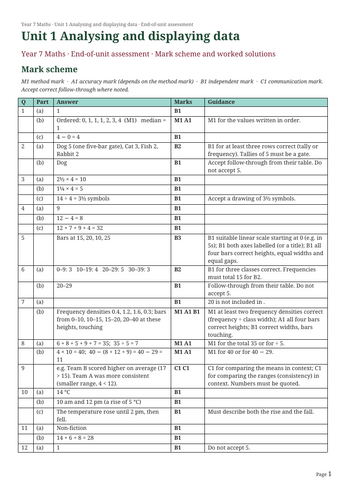
• GCSE-style exam questions with a mark scheme labelled M1, A1, B1, P1 and C1
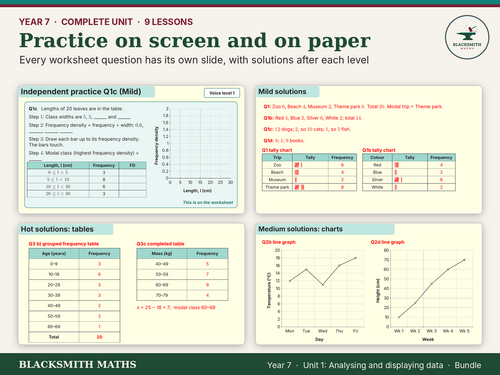
• Solutions slides after every level, full teacher answers and an exit ticket
Across the unit
• 523 teaching slides
• 122 worksheet questions plus extension challenges
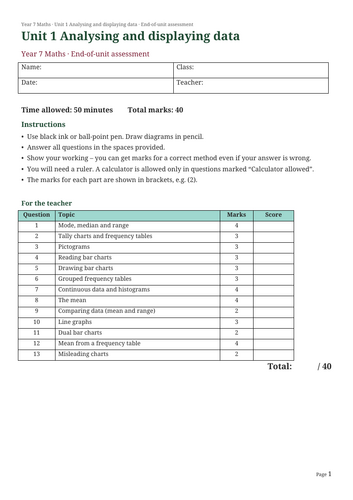
• 50 GCSE-style exam questions worth 95 marks
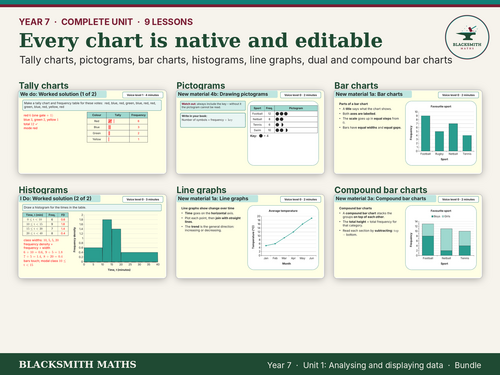
• Native, editable charts throughout: tally charts, pictograms, bar and bar-line charts, grouped frequency tables, histograms (including unequal class widths), line graphs, dual and compound bar charts
Why teachers like it
• Each lesson is planned for 2 hours and easy to cut to 1 hour (instructions on the hidden teacher slide)
• Change any number in any chart or table in seconds
• Consistent, uncluttered design, with algebra and fractions written as proper equations
• Short, simple file names that open on any school network
Note: Lesson 5 includes frequency density (GCSE Higher content) as stretch.
Something went wrong, please try again later.
This resource hasn't been reviewed yet
To ensure quality for our reviews, only customers who have purchased this resource can review it
Report this resourceto let us know if it violates our terms and conditions.
Our customer service team will review your report and will be in touch.
£5.00