

Generate student enthusiasm for presenting survey results in suitable graph form, by making the information to be gathered about the students themselves, and their use of appropriate graphs to display this data in the classroom.
This PowerPoint asks students to survey the class members with 5 questions each then prepare 5 different forms of graph in a display. (students may work individually or in pairs)
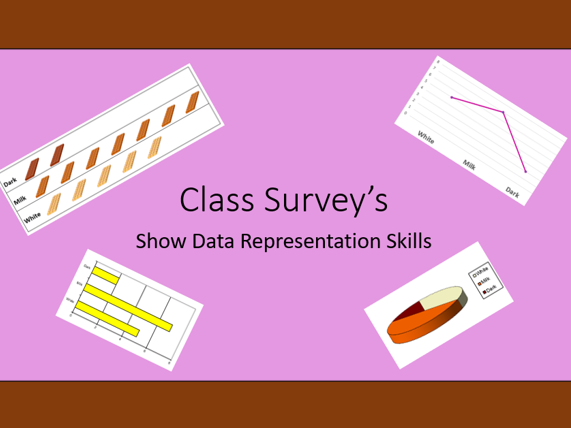
It shows one small set of data represented by ten different graphs, for you to discuss appropriateness with students, or recommend graph types for question types (i.e. Column graph to show height comparisons.) Then lists 15 suggested survey topics (also included as a word document if you wish to print this) however I recommend encouraging students to generate their own questions as far as possible.
Something went wrong, please try again later.
This resource hasn't been reviewed yet
To ensure quality for our reviews, only customers who have purchased this resource can review it
Report this resourceto let us know if it violates our terms and conditions.
Our customer service team will review your report and will be in touch.
£2.00