


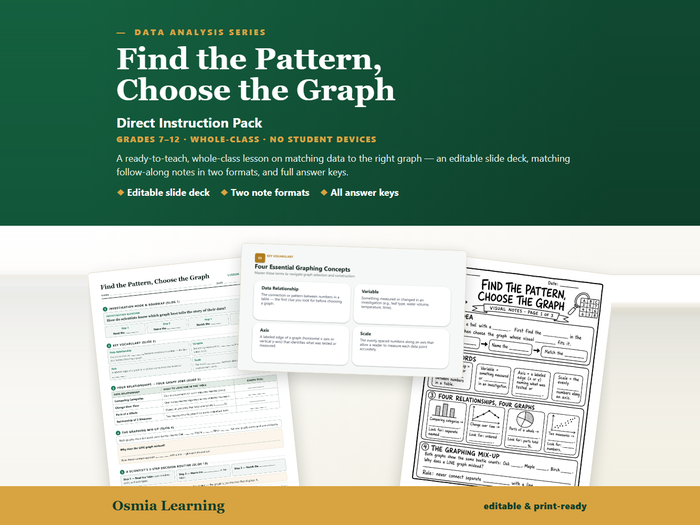

Teach graph selection directly to Grades 7–12 with this self-contained, no-device lesson. Students match data relationships to bar, line, circle, or scatter graphs and defend their choices.
What is included
- Fully editable 16:9 PowerPoint slide deck with teacher notes (18 slides)
- Project-ready PDF version of the complete presentation
- Structured Guided Notes student packet
- Illustrated Visual Notes student packet
- Matching teacher answer keys for both note formats
- 3-page Direct Instruction Teacher Guide with pacing, common mix-ups, and grading guidance
- Terms of use
Classroom use
Project the editable deck for whole-class instruction while students complete either note format. Use the second format for differentiation, review, makeup work, or a substitute plan. The pack is complete for offline teaching; students name the data relationship, choose a graph, title it clearly, and defend the choice with evidence. Grades 7–12. Best fit for middle school science, biology, environmental science, and data-analysis units. Single-teacher license. © Osmia LLC.
Related TES resources
Something went wrong, please try again later.
This resource hasn't been reviewed yet
To ensure quality for our reviews, only customers who have purchased this resource can review it
Report this resourceto let us know if it violates our terms and conditions.
Our customer service team will review your report and will be in touch.
$5.00