
Completely resourced lesson on distance-time graphs with key content from AQA and Edexcel Physics.
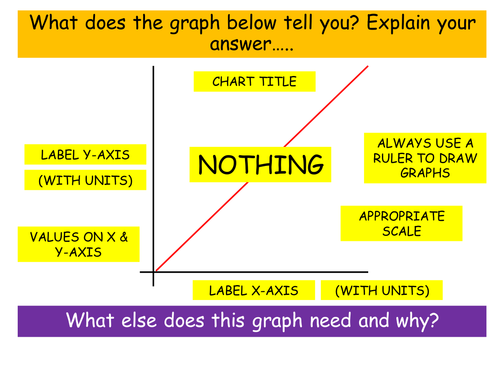
Lesson begins with a review of the use of graphs to present data and relationships, highlighting key graph vocabulary and trends.
Speed, distance and time is briefly recapped with the equation and some simple questions.
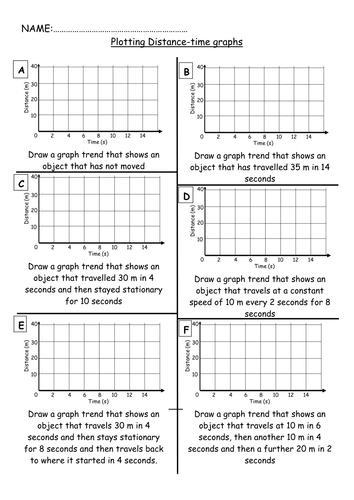
An exercise in plotting distance-time graphs from a short description allows pupils to understand what different trends mean on a d-t graph by plotting them, themselves.
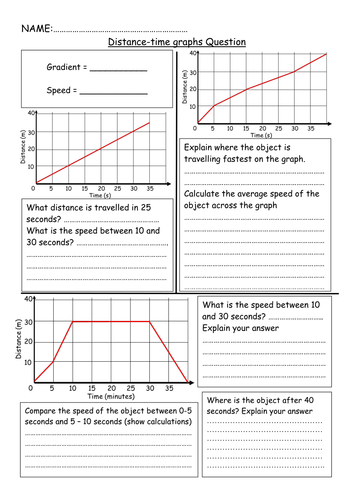
Following this it is explained in detail how a d-t graph gradient calculates speed by relating this clearly to the equation for speed.
A class experiment is detailed if you wish to allow your pupils to carry this out but if not another activity following summarises the same concepts through a pre-prepared worksheet.
A homework task is included that will require some modelling from the teacher.
Lesson begins with a review of the use of graphs to present data and relationships, highlighting key graph vocabulary and trends.
Speed, distance and time is briefly recapped with the equation and some simple questions.
An exercise in plotting distance-time graphs from a short description allows pupils to understand what different trends mean on a d-t graph by plotting them, themselves.
Following this it is explained in detail how a d-t graph gradient calculates speed by relating this clearly to the equation for speed.
A class experiment is detailed if you wish to allow your pupils to carry this out but if not another activity following summarises the same concepts through a pre-prepared worksheet.
A homework task is included that will require some modelling from the teacher.
Something went wrong, please try again later.
This resource hasn't been reviewed yet
To ensure quality for our reviews, only customers who have purchased this resource can review it
Report this resourceto let us know if it violates our terms and conditions.
Our customer service team will review your report and will be in touch.
£1.00