
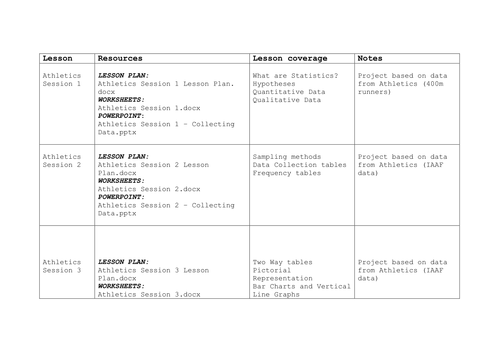
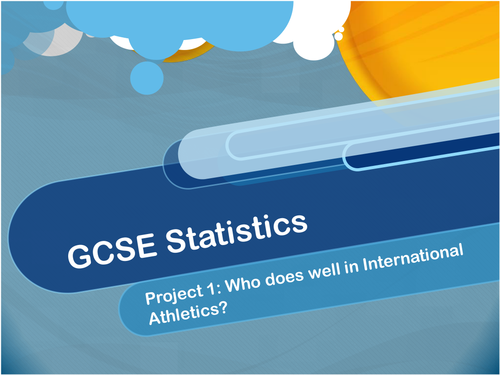
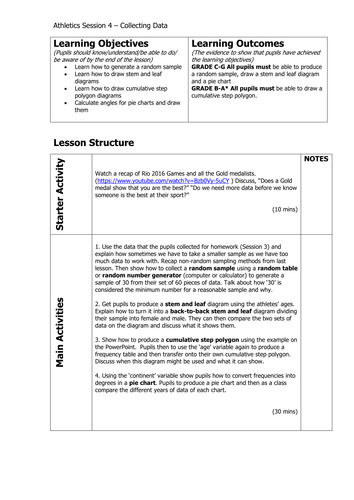
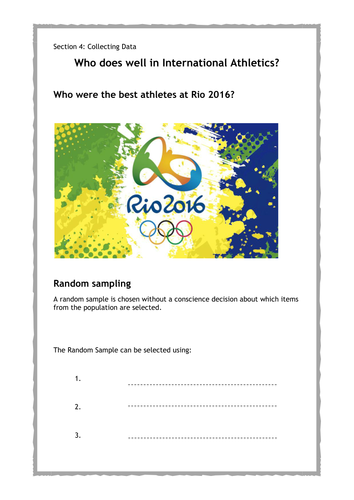
For Year 10 and 11 GCSE Statistics students. Using a real-life project approach this is the fourth lesson looking at data collection from Athletics statistics. Included is the lesson plan with links to videos, the Powerpoint presentation for the lesson and worksheets for students. There is also an overview of the full 5 lesson project. This lesson looks at how to generate a random sample, draw stem and leaf diagrams and cumulative step polygon diagrams, calculate angles in pie charts and then draw them. Can be adapted and used as a one-off lesson.
Something went wrong, please try again later.
Excellent saved me so much time and makes statistics more enjoyable. Anymore like this would be welcome especially if aimed at higher level graphs. Thank you so much
A little dated (2016 Olympics) and difficult to change to more up to date event without rewriting everything.
Report this resourceto let us know if it violates our terms and conditions.
Our customer service team will review your report and will be in touch.
£2.00