

Handling data (two days).
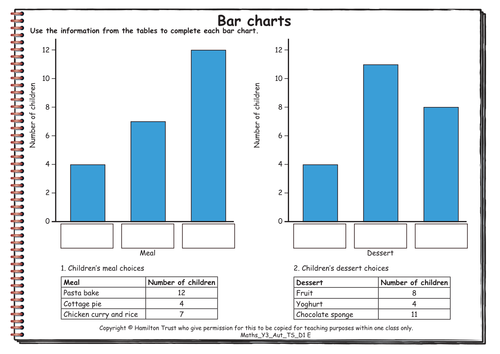
Children use data gathered in teaching sequence M1 and from tally charts to construct bar charts, first with the vertical axis labelled in ones, and then in twos. They use information from frequency tables to complete missing labels on bar charts.
Find additional lesson plans and resources at www.hamilton-trust.org.uk.
Something went wrong, please try again later.
Detailed planning on data handling using block graphs and pictograms, for Year 3.
Report this resourceto let us know if it violates our terms and conditions.
Our customer service team will review your report and will be in touch.
£0.00