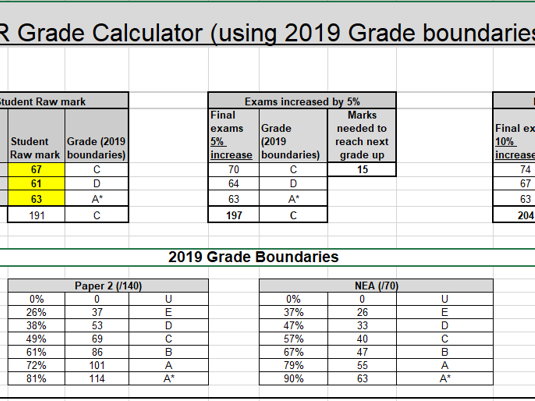

I have created this quick grade calculator to help predict grades a little more accurately.
This uses the 2019 grade boundaries and raw marks from Paper 1, Paper 2 and NEA. I have used my most recent mock exams for the Paper 1 and Paper 2 marks.
I have then added a table that calculates 5% added to the exam paper raw marks, and another table with 10% (students always do slightly better in their final exams compared to their mocks and you may see a pattern from past year groups between 5 and 10% increase). Both tables have a cell that calculates how many marks would be needed to get up to the next grade (ie if, with the 5% added, the student is on a C grade - how many more marks would they need to get for the B grade).
Of course, due to covid the grade boundaries are very likely to come down slightly but I have found the “how many more marks” has been really helpful to see if I think the student has a chance for that next grade up… usually you can see if it is really unlikely (I don’t think the grade boundaries are going to come down substantially).
I hope this helps with predictions, but also to help discuss what they need to be working toward on their individual papers.
Something went wrong, please try again later.
This resource hasn't been reviewed yet
To ensure quality for our reviews, only customers who have purchased this resource can review it
Report this resourceto let us know if it violates our terms and conditions.
Our customer service team will review your report and will be in touch.
£2.00