
LESSON COVERS:
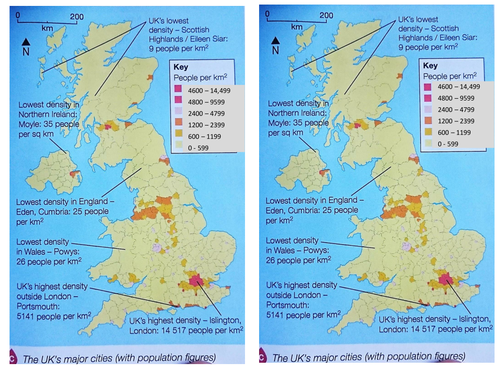
looking at why some areas of the UK became heavily populated in the past, and why some areas are heavily populated now (looking at job availability, economic opportunities, culture, etc)
LESSON INVOLVES:
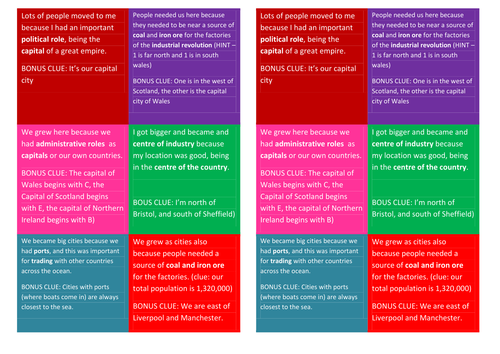
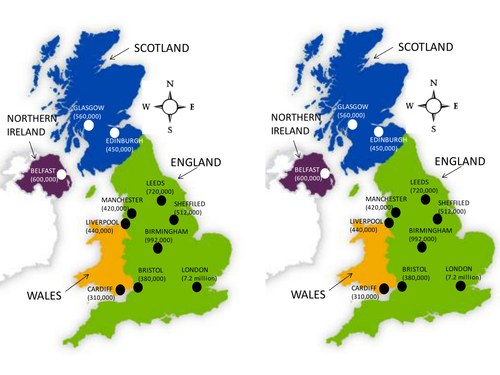
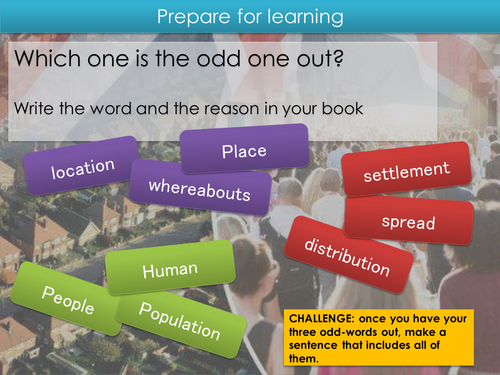
identifying key words (location, distribution and settlement), using clues about urban growth to identify major cities on a map. Students annotate and draw arrows onto a map to show how urban areas and populations are changing now, identifying influencing factors and making predictions, and looking for similarities between influencing factors in the past and now. Lesson ends with an exam question.
RESOURCES:
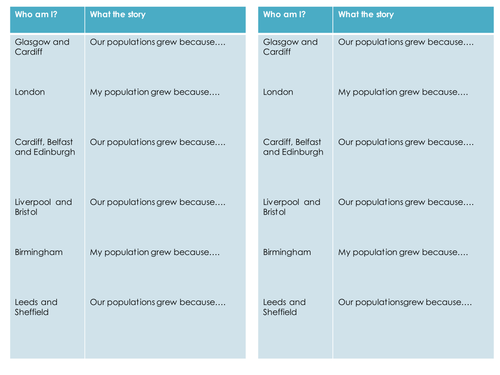
there are two maps with this lesson, the "Who am I maps" have the options for the clues on them, the "So now..." maps are for the annotation task. There is also a bonus clues sheet for those struggling with the Who am I task, as well as a partially complete table for those student who may need it.
NOTES:
the annotating map task will require prior knowledge of reasons why people migrate. If you haven't studied that in this unit yet you can teach or tweak the lesson accordingly.
Please review with any feedback :-)
looking at why some areas of the UK became heavily populated in the past, and why some areas are heavily populated now (looking at job availability, economic opportunities, culture, etc)
LESSON INVOLVES:
identifying key words (location, distribution and settlement), using clues about urban growth to identify major cities on a map. Students annotate and draw arrows onto a map to show how urban areas and populations are changing now, identifying influencing factors and making predictions, and looking for similarities between influencing factors in the past and now. Lesson ends with an exam question.
RESOURCES:
there are two maps with this lesson, the "Who am I maps" have the options for the clues on them, the "So now..." maps are for the annotation task. There is also a bonus clues sheet for those struggling with the Who am I task, as well as a partially complete table for those student who may need it.
NOTES:
the annotating map task will require prior knowledge of reasons why people migrate. If you haven't studied that in this unit yet you can teach or tweak the lesson accordingly.
Please review with any feedback :-)
Something went wrong, please try again later.
This resource hasn't been reviewed yet
To ensure quality for our reviews, only customers who have purchased this resource can review it
Report this resourceto let us know if it violates our terms and conditions.
Our customer service team will review your report and will be in touch.
£2.00