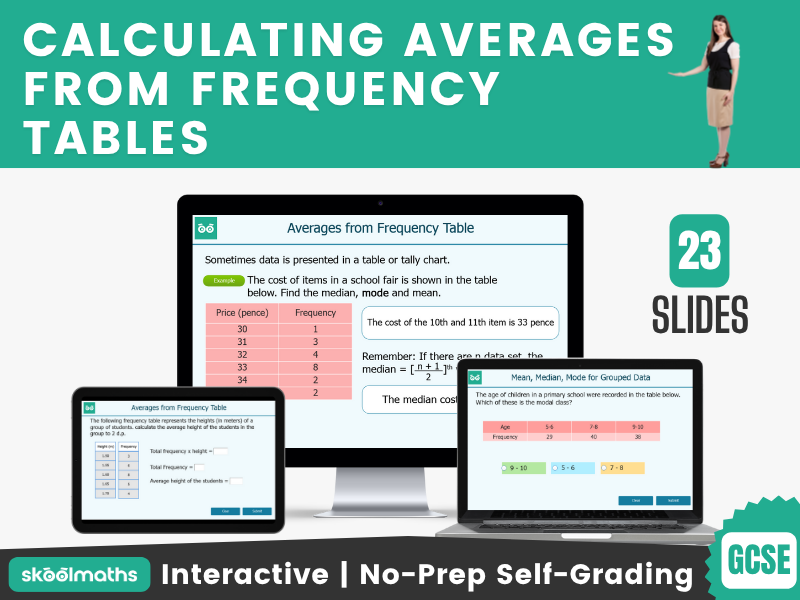

Calculating Averages from Frequency Tables
Engage your GCSE Maths class with this comprehensive interactive maths lesson with differentiated self-marking activities. This ultimate GCSE Teacher’s Toolkit will teach your learners how to calculate averages from frequency tables! Designed with GCSE educators in mind, this all-in-one solution is tailored to streamline your teaching approach and enhance student engagement while saving you valuable on lesson planning time.
By the end of this unit, learners will be able to:
- Understand the concept of frequency tables and their role in summarizing data.
- Calculate the mean and other measures of central tendency from a frequency table.
- Apply the concept of frequency tables to real-world data scenarios.
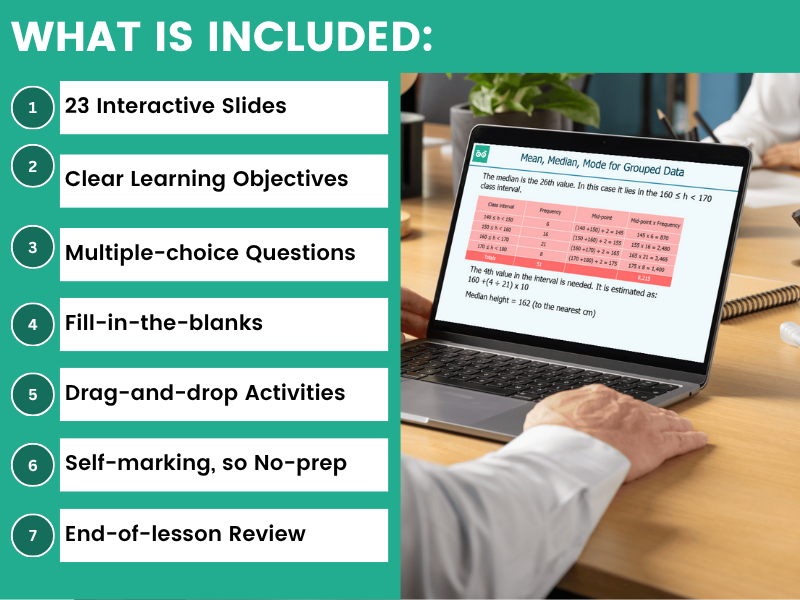
What’s Included
- Three-part Lesson
- Self-marking Activities
- Fluency, Reasoning and Problem-solving Questions.
- Engaging Drag and Drop Activities
- Interactive Self-marking Worksheet
- Printable Worksheets to Consolidate Learning
Love this? You will love…
Something went wrong, please try again later.
This resource hasn't been reviewed yet
To ensure quality for our reviews, only customers who have purchased this resource can review it
Report this resourceto let us know if it violates our terms and conditions.
Our customer service team will review your report and will be in touch.
£3.39