

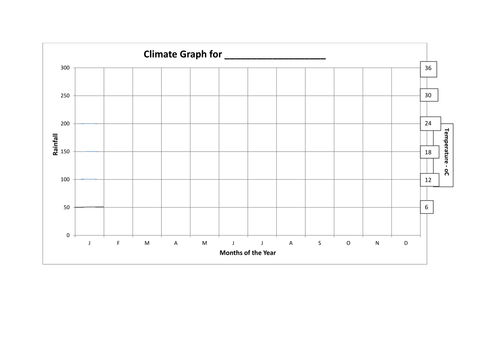


Lesson demonstrates to students what a climate graph is before they then draw examples. Data for three different locations included. There are differentiated pro-formas. Students can either draw them from scratch, have the outline ready for them or complete a half-ready graph. There is then a cloze exercise for describing the graphs.
Something went wrong, please try again later.
This resource hasn't been reviewed yet
To ensure quality for our reviews, only customers who have purchased this resource can review it
Report this resourceto let us know if it violates our terms and conditions.
Our customer service team will review your report and will be in touch.
£3.00