

A tiered booklet I created for use with year 10/11 intervention groups.
These can be used in small groups led by a teacher/MKO enabling students to progress towards improving their understanding and ability with plotting straight line graphs.
Each objective is accompanied by a corresponding task that increases with difficulty. There is also a helpful 'Steps to Success' section which provides key points to remember/perform when completing the questions.
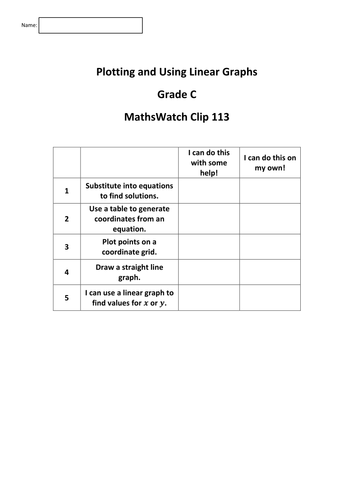
There is an evaluation section at the front to help students identify key areas for improvement in order to focus their home learning after intervention sessions. There is a MathsWatch clip number provided to further enable students to review their learning at home.
In this booklet, the objectives are:
1 - Substituting into equations to find solutions.
2 - Using/creating a table of values from a given equation.
3 - Reading coordinates from a table of values.
4 - Plotting the coordinates to create the straight line graph.
5 - (Extension) Using a created linear graph to find solutions.
Please leave feedback for areas of improvement or any topics you would like to see created in this format.
There are two files: one for old style GCSE (A* - G) and another for the 2015 specifications (9 - 1)
These can be used in small groups led by a teacher/MKO enabling students to progress towards improving their understanding and ability with plotting straight line graphs.
Each objective is accompanied by a corresponding task that increases with difficulty. There is also a helpful 'Steps to Success' section which provides key points to remember/perform when completing the questions.
There is an evaluation section at the front to help students identify key areas for improvement in order to focus their home learning after intervention sessions. There is a MathsWatch clip number provided to further enable students to review their learning at home.
In this booklet, the objectives are:
1 - Substituting into equations to find solutions.
2 - Using/creating a table of values from a given equation.
3 - Reading coordinates from a table of values.
4 - Plotting the coordinates to create the straight line graph.
5 - (Extension) Using a created linear graph to find solutions.
Please leave feedback for areas of improvement or any topics you would like to see created in this format.
There are two files: one for old style GCSE (A* - G) and another for the 2015 specifications (9 - 1)
Something went wrong, please try again later.
This resource hasn't been reviewed yet
To ensure quality for our reviews, only customers who have purchased this resource can review it
Report this resourceto let us know if it violates our terms and conditions.
Our customer service team will review your report and will be in touch.
£2.00