
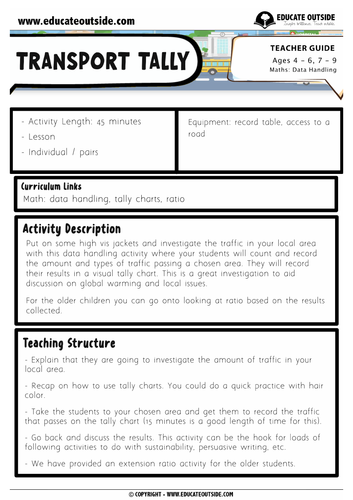
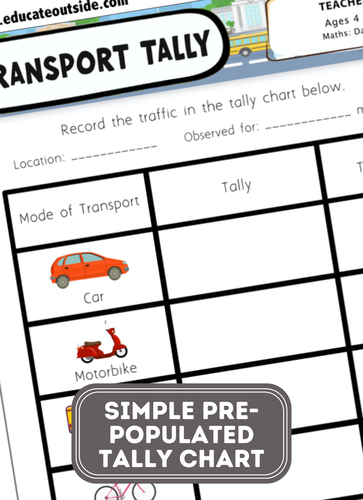
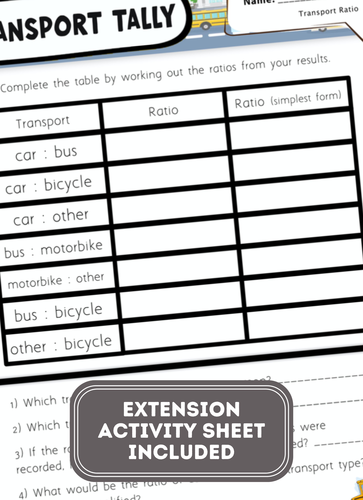
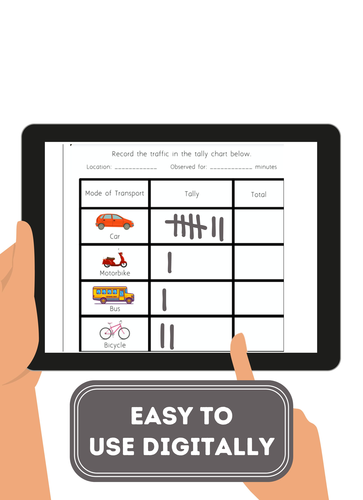
Put on some high vis jackets and investigate the traffic in your local area with this data handling activity where your students will count and record the amount and types of traffic passing a chosen area. They will record their results in a visual tally chart. This is a great investigation to aid discussion on global warming and local issues. For the older children you can go onto looking at ratio based on the results collected.
Check out our other data handling resources:
Please don’t forget to rate this resource to let us know what you think.
Also, be sure to visit my store and FOLLOW ME to see my new products and hear about upcoming sales!
Something went wrong, please try again later.
This resource hasn't been reviewed yet
To ensure quality for our reviews, only customers who have purchased this resource can review it
Report this resourceto let us know if it violates our terms and conditions.
Our customer service team will review your report and will be in touch.
£2.60