
This lesson plan/presentation includes all the activities (including student worksheets/mark schemes/homework tasks and assessment guidance) required to achieve the following learning objectives:
1) Describe the nature of an oxygen dissociation curve - Activity 1: to complete key definitions using a link to a video resource that will support students to complete the definitions; Activity 2: competition to be completed in groups to collect as much information as possible within a 60 second period (resource provided in the PowerPoint for printing); Activity 3: annotation of the pupil worksheet (resource provided in the PowerPoint for printing) aims to consolidate the information from Activity 2; Exam Question with Mark Scheme (provided in the PowerPoint)
2) Explain the effect of carbon dioxide concentration on the curve and the reasons why - Activity 4: identifying the % saturation of oxygen in the tissues and in the lung on a graph (resource provided in the PowerPoint for printing); Exam Question with Mark Scheme (provided in the PowerPoint); an idea for a student homework activity looks to have students discuss the factors that affect the oxygen disassociation curve (pH, CO2 concentration, exercise and temperature) is outlined (information for assessing homework is provided in the PowerPoint).
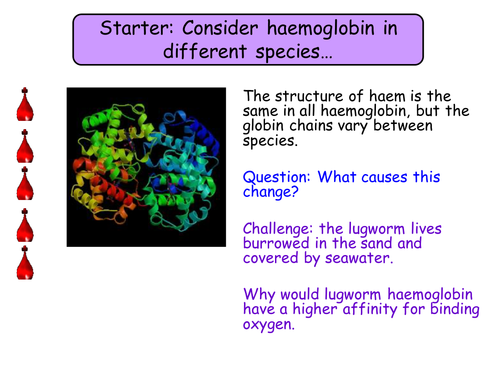
3) Explain how the properties of the haemoglobins in different organisms relate to the environment and way of life of the organism concerned - Starter task: probes questions on the structure of haemoglobin in different species then puts this into context by considering the lugworm, the llama and small organisms (mice) with a higher metabolic rate.
1) Describe the nature of an oxygen dissociation curve - Activity 1: to complete key definitions using a link to a video resource that will support students to complete the definitions; Activity 2: competition to be completed in groups to collect as much information as possible within a 60 second period (resource provided in the PowerPoint for printing); Activity 3: annotation of the pupil worksheet (resource provided in the PowerPoint for printing) aims to consolidate the information from Activity 2; Exam Question with Mark Scheme (provided in the PowerPoint)
2) Explain the effect of carbon dioxide concentration on the curve and the reasons why - Activity 4: identifying the % saturation of oxygen in the tissues and in the lung on a graph (resource provided in the PowerPoint for printing); Exam Question with Mark Scheme (provided in the PowerPoint); an idea for a student homework activity looks to have students discuss the factors that affect the oxygen disassociation curve (pH, CO2 concentration, exercise and temperature) is outlined (information for assessing homework is provided in the PowerPoint).
3) Explain how the properties of the haemoglobins in different organisms relate to the environment and way of life of the organism concerned - Starter task: probes questions on the structure of haemoglobin in different species then puts this into context by considering the lugworm, the llama and small organisms (mice) with a higher metabolic rate.
Get this resource as part of a bundle and save up to 53%
A bundle is a package of resources grouped together to teach a particular topic, or a series of lessons, in one place.
Something went wrong, please try again later.
This resource hasn't been reviewed yet
To ensure quality for our reviews, only customers who have purchased this resource can review it
Report this resourceto let us know if it violates our terms and conditions.
Our customer service team will review your report and will be in touch.
£2.90