


The is a resource to deliver scatter graphs to KS3 or GCSE.
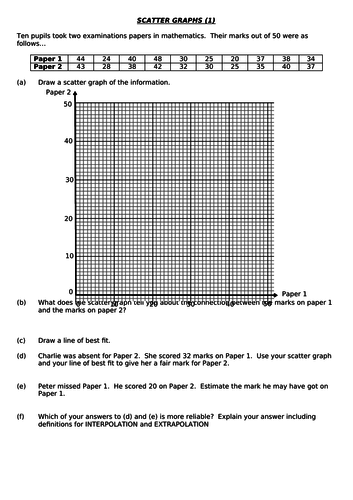
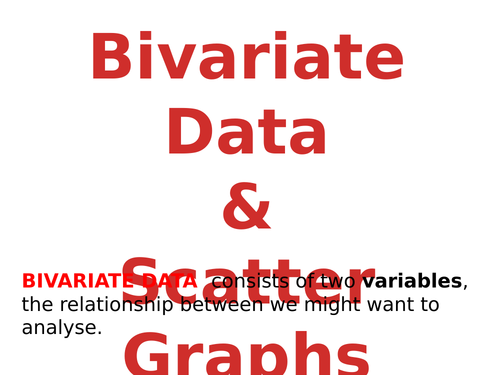
It includes a powerpoint which covers the definition of bivariate data and correlation along with two worked examples (one involving positive and once negative correlation) walking students through how to plot a scatter graph, define the type of correlation, draw a line of best fit and use it to make estimates. It also investigates reliability of estimates, introducing the terms interpolation and extrapolation.
There is a card sort early in the activity looking at different types of bivariate data and trying to get the students to think about the different types of correlation (before it is mentioned in the powerpoint).
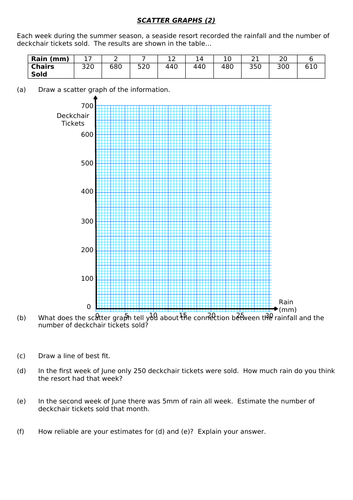
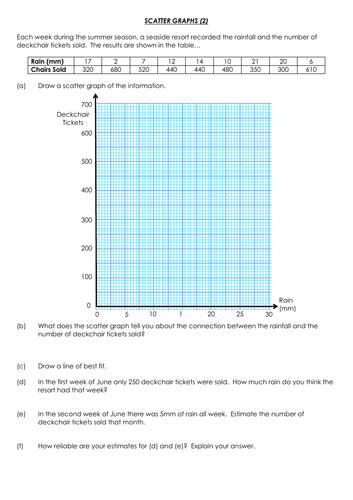
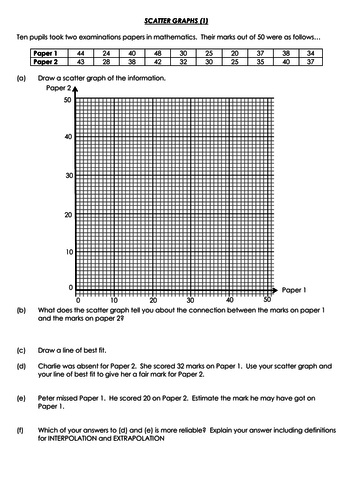
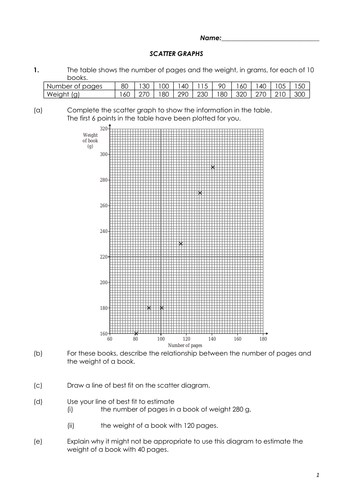
There is an assessment with four questions - along with solutions for the assessment.
The card sort, two worked examples and the assessment and solutions are given in word format and PDF.
Something went wrong, please try again later.
great resources, thank you for sharing
Great resource, easy to follow in the lesson.
Great variety of questions regarding scatter plots and bivariate data. Thank you.
Excellent resources and easy to understand by my boy. Thanks for sharing
excellent ppt, this will help a lot. Thank you for sharing.
Report this resourceto let us know if it violates our terms and conditions.
Our customer service team will review your report and will be in touch.
£0.00