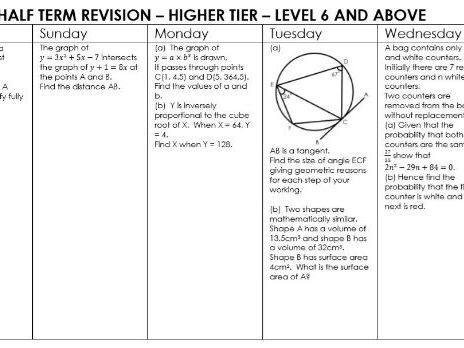
Hero image

Mr Chadburn's Shop

Average Rating4.80
(based on 204 reviews)

Mathematics teacher who works in an 11-18 school in Sheffield

19Uploads

139k+Views

332k+Downloads

Mathematics teacher who works in an 11-18 school in Sheffield
Rounding Numbers Worksheet: Premier League
alexsabellaalexsabella

Rounding Numbers Worksheet: Premier League

(22)
A worksheet (word document) with attendances from one Premier League weekend allowing pupils to work with place value and rounding to the nearest 10, 100, 1000 and 10000. Also good practice for writing numbers in words. Ideal activity for KS3 maths students.
First order differential equations
alexsabellaalexsabella

First order differential equations

(3)
This is a powerpoint, designed to deliver the 1st order differential equations using the integrating factor method which is part of the core 2 section of the A level Further mathematics course.
Angles in all four quadrants
alexsabellaalexsabella

Angles in all four quadrants

(3)
This resource is designed to deliver finding the sine, cosine and tangent of any angle in the form of a trig ratio of an acute angle using the CAST diagram. It also looks at exact values of sin, cos and tan of 30, 45 and 60. There are two exercises included.
Modelling with differential equations
alexsabellaalexsabella

Modelling with differential equations

(5)
This is a powerpoint aimed to delivering the Further mathematics Core 2 topic of modelling with differential equations. The first and second order differential equations topics need to be covered before this. It covers basic modelling using first order differential equations, simple harmonic motion, damped and forced harmonic motion and coupled first order differential equations. In each case at least two fully worked examples are given.
S2 EDEXCEL Powerpoints
alexsabellaalexsabella

S2 EDEXCEL Powerpoints

(34)
These are powerpoints and associated pupil notes I have used to deliver S2 to my Y12 further mathematics class. They are tailored to the EDEXCEL S2 syllabus. Please contact me if you notice errors or you have any other comments and please leave feedback - would be nice to know if people are using them or find them useful.
Transformation of graphs
alexsabellaalexsabella

Transformation of graphs

(18)
This resources is designed to deliver the transformation of graphs for the GCSE higher tier course and the A level course. The powerpoint takes the student through the two translations and two reflections (as far as you need to go for GCSE) and then the two stretches (A level but if you want to stretch some of your able GCSE students and give them a taste of A level, you can include this as part of your GCSE teaching also). Also included are links to a desmos file which models these transformations and can be used to show the effect with various constants. It develops into multiple transformations and the effects on coordinates as well as sketching graphs which have under-gone transformations. If teaching GCSE I suggest stopping at slide 24. Slides 25 onwards deal with stretches. Of course if you wish to stretch your GCSE group and expose them to some A level work, feel free to continue. If teaching A level, omit slides 16 to 24 which are questions but these only include work on translations and reflections. Many of these are included later on along with stretches. I have included worksheets which include blanks of the graphs used as well as the questions and summary table. I tried copying them into an A5 booklet to save money on photocopying but to be honest the quality isn’t good and they are too small - if using probably go the whole hog and print as an A4 booklet. (There are word and PDF copies of each - one with the GCSE stuff on only and one with A level stuff as well).
GCSE Transformations
alexsabellaalexsabella

GCSE Transformations

(0)
This resource is a powerpoint which delivers the four transformations, translations, reflections, rotations and enlargements up to higher tier work on negative enlargements. It involves explaining how to describe and draw each transformation through examples.
Half Term Revision Resources
alexsabellaalexsabella

Half Term Revision Resources

(0)
A resource designed to allow students to have focused daily practice on a wide range of GCSE mathematics topics over a week - it was designed for the February half term, but could easily be designed for any particular week (Saturday, Sunday through to the following Sunday). There is an editable word file with the three different calendars on (Higher for level 6 and above, crossover for 4/5 and Foundation for level 3 and below). You might want to set 2 of these depending on the tier of entry - higher/crossover or crossover/foundation. Also attached are worked solutions to all three.
Exact values for 30, 45 and 60 degrees
alexsabellaalexsabella

Exact values for 30, 45 and 60 degrees

(1)
This is a powerpoint which is designed to explain how to find the exact values for 30, 45 and 60 degrees. All of this is suitable for higher tier. The explanations and the first two examples would also be suitable for Foundation.
Vectors
alexsabellaalexsabella

Vectors

(1)
This is a powerpoint presentation with associated PDF of questions aimed at delivering the higher tier part of the GCSE mathematics specification including geometric proofs such as proving lines are parallel or three points form a straight line.
2nd order differential equations
alexsabellaalexsabella

2nd order differential equations

(2)
This resource is designed to deliver 2nd order differential equations as part of the Core mathematics 2 section of the Further Mathematics A level curriculum. It is a powerpoint which covers homogeneous and non-homogeneous 2nd order equations with and without boundary conditions.
GCSE mathematics revision calendars
alexsabellaalexsabella

GCSE mathematics revision calendars

(4)
Calendars that provide daily practice to prepare for GCSE mathematics exams. For each month there is a higher calendar designed for those aiming at level 6 or higher and a foundation/foundation plus calendar for those looking at level 4/5 and probably doing the foundation tier.
Cumulative Frequency and Box Plots
alexsabellaalexsabella

Cumulative Frequency and Box Plots

(3)
This presentation (with associated worksheets) takes you through how to draw a cumulative frequency diagram, how to use it to estimate median, IQR and other things. It also takes you through how to draw a box and whisker diagram using a CF graph as a means of doing this along with comparing and contrasting two similar sets of data.
The graphs of sine, cosine and tangent
alexsabellaalexsabella

The graphs of sine, cosine and tangent

(6)
This resource explains how to generate the graphs of sine, cosine and tangent. It used the unit circle to help explain this. It also goes on to look at translations and reflections of the trig functions. It includes pupil worksheets used in the powerpoint in word and PDF form.
Introduction to decimals
alexsabellaalexsabella

Introduction to decimals

(44)
This is a set of resources I designed for a low ability year 7 group I teach to introduce the concept of decimals and their size and different ways of displaying them. I focus mainly on one and two decimal place numbers. It could lead to work on ordering decimals. The student sheet is designed for them to fill in with place value and examples. There is then a shading sheet for tenths and one for hundredths. Finally there are some cards which contain 9 different 1 and 2 decimal place numbers where pupils have to sort into their groups - decimal number version, shaded version (using a 10x10 grid), number line version and a version where the decimal is spelled. This could develop into understanding that, say, 0.4 is larger than 0.18 - a common misconception. There is a powerpoint attached that works through all this. Happy to send powerpoint in earlier version or the worksheets in word to allow editing if you want. Let me know how you get on with them. I have a website, mrchadburn.co.uk which I'm hoping to upload this and other resources. Please keep visiting as it develops and comments, criticisms keenly accepted.
Histograms
alexsabellaalexsabella

Histograms

(3)
This powerpoint presentation and associated worksheet is designed to deliver how to draw a histogram and use it make estimates as well as questions where the histogram is given (without the frequency density) and either the frequency table or histogram has to be completed as well as estimates. It is designed for the GCSE Higher tier not the A level statistics histogram work (where frequency is not always equal to area).
Bivariate Data and Scatter Graphs
alexsabellaalexsabella

Bivariate Data and Scatter Graphs

(12)
The is a resource to deliver scatter graphs to KS3 or GCSE. It includes a powerpoint which covers the definition of bivariate data and correlation along with two worked examples (one involving positive and once negative correlation) walking students through how to plot a scatter graph, define the type of correlation, draw a line of best fit and use it to make estimates. It also investigates reliability of estimates, introducing the terms interpolation and extrapolation. There is a card sort early in the activity looking at different types of bivariate data and trying to get the students to think about the different types of correlation (before it is mentioned in the powerpoint). There is an assessment with four questions - along with solutions for the assessment. The card sort, two worked examples and the assessment and solutions are given in word format and PDF.