
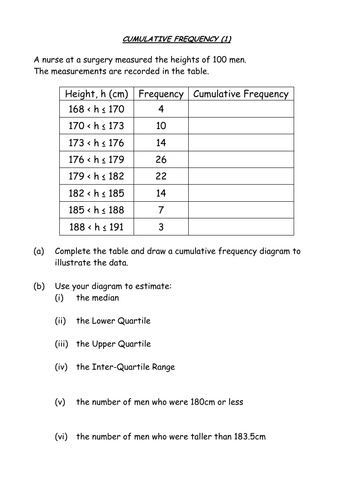
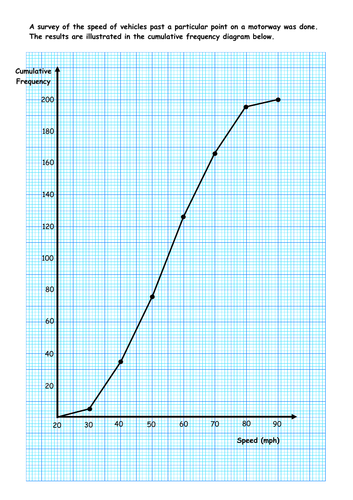
This presentation (with associated worksheets) takes you through how to draw a cumulative frequency diagram, how to use it to estimate median, IQR and other things. It also takes you through how to draw a box and whisker diagram using a CF graph as a means of doing this along with comparing and contrasting two similar sets of data.
Something went wrong, please try again later.
Thanks so much! amazing resources.
Thank you
Report this resourceto let us know if it violates our terms and conditions.
Our customer service team will review your report and will be in touch.
£0.00