
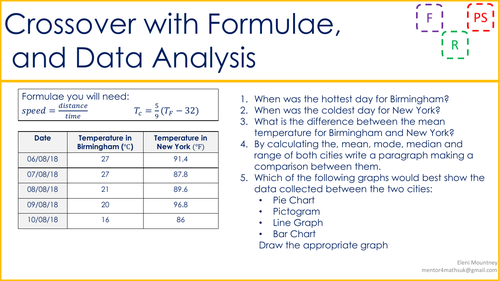
This week’s first Crossover Resource looks at formulae and data analysis, where students are given data, formula and have to answer questions after inputting the data into the formulae. They then have to decide which is the best graph for them to choose to best display the data.
This could be adapted to add in some challenge or more depth my exploring the ways that data could have been collected, why do different people have different journeys and what factors could affect the journey to work.
More to come!
Something went wrong, please try again later.
Just what I was looking for!
Great use of data analysis on the two questions that form the basis for the questions, thanks.
Report this resourceto let us know if it violates our terms and conditions.
Our customer service team will review your report and will be in touch.
£0.00