


Dojo Behaviour Analyser — Whole Class Tracker
Upload a single ClassDojo class report CSV and instantly get a comprehensive visual breakdown of your whole group’s behaviour record — from class-wide totals and positive rates to individual pupil rankings, behaviour-by-behaviour breakdowns, and a clear view of which pupils need support and which deserve recognition. The tool runs entirely in your browser — nothing is uploaded, nothing is stored, and no login is required. A full illustrated user guide is included, covering every feature with annotated screenshots, export instructions, and a FAQ, so any colleague can pick it up and use it confidently without any training.
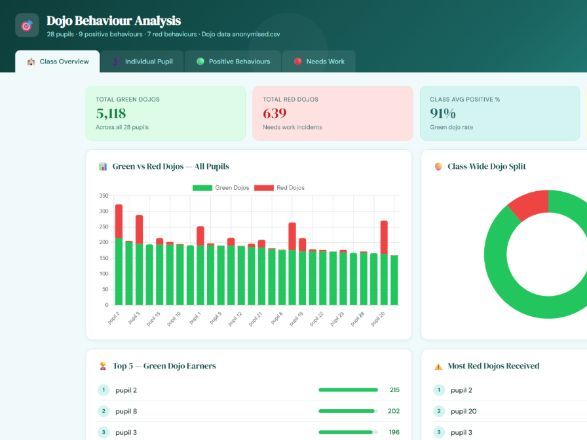
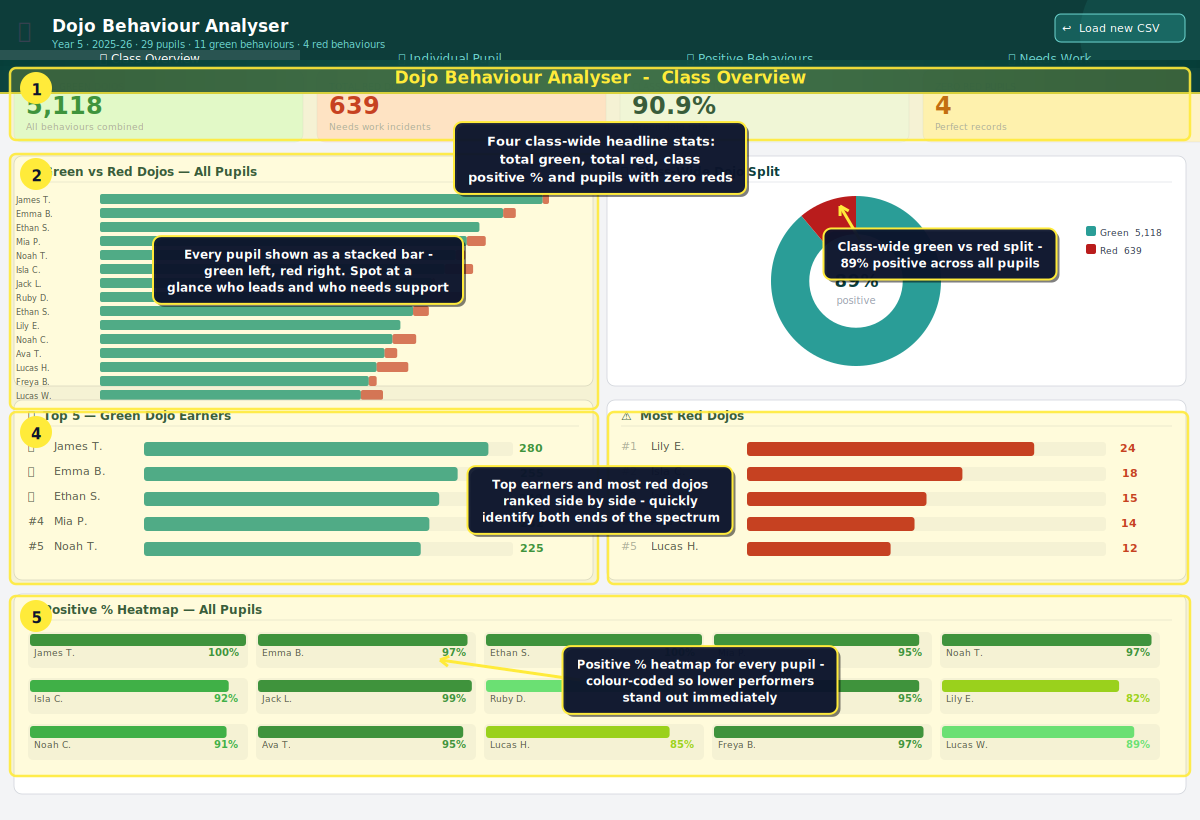
CLASS OVERVIEW TAB
Four headline stats show total green dojos, total red dojos, the class average positive rate, and the number of pupils with a completely clean record. A stacked bar chart displays every pupil side by side — green left, red right — so the spread across the class is visible at a glance. Top 5 green earners and top 5 red dojo holders are ranked side by side, and a colour-coded positive percentage heatmap shows every pupil’s rate in one view, making lower performers stand out immediately.
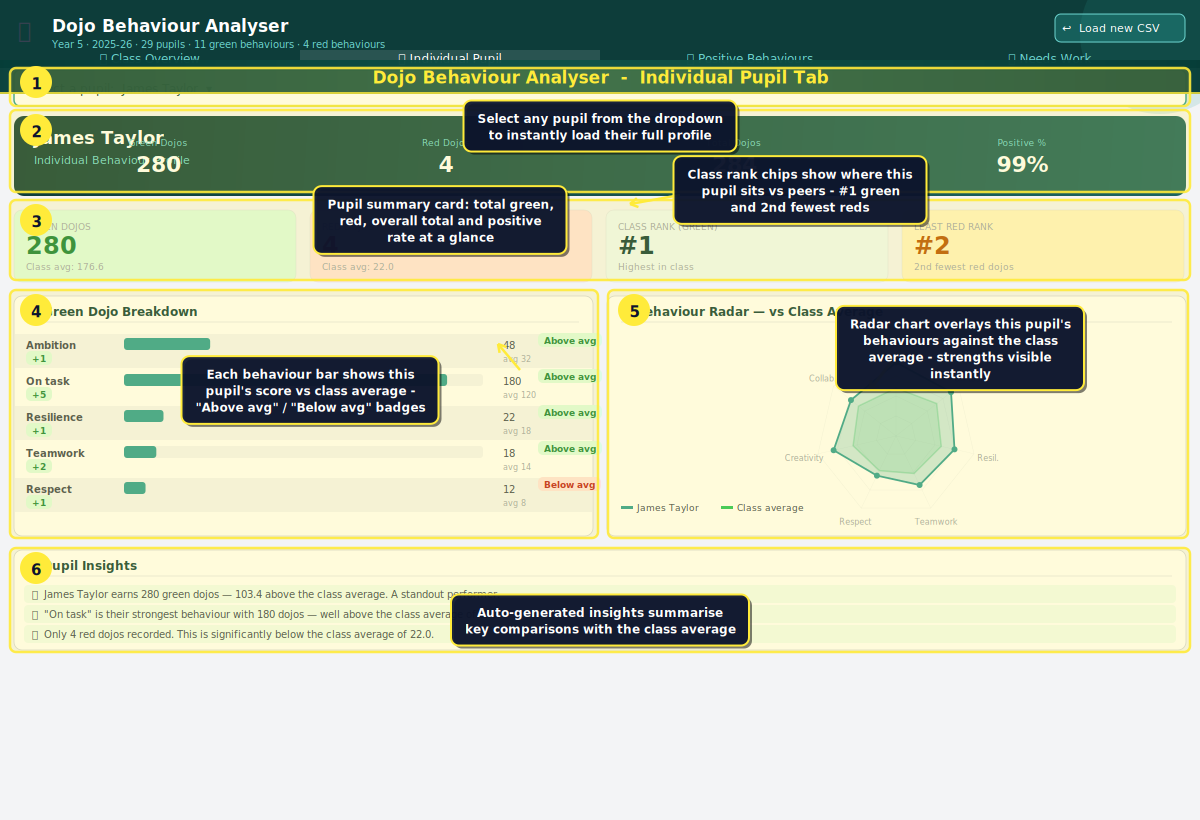
INDIVIDUAL PUPIL TAB
Select any pupil from a dropdown to load their full profile instantly. A summary card shows their green total, red total, and positive rate, alongside class rank chips showing where they sit relative to their peers. A behaviour breakdown table compares each skill against the class average with Above Average and Below Average badges, and a radar chart overlays the pupil’s profile against the class average so strengths and gaps are visible at a glance. Auto-generated insights summarise the key comparisons in plain language.
I have another resource available that goes into much more detail for an individual pupil if this is something you are interested in
POSITIVE BEHAVIOURS TAB
A ranked bar chart shows every green behaviour category by total points across the class, alongside a donut chart showing each behaviour’s share of the overall green total. A full pupil leaderboard displays every child as a stacked bar broken down by behaviour, with their score compared against the class average — useful for identifying which pupils are strong across multiple categories and which are relying heavily on one.
NEEDS WORK TAB
The same structure applied to red dojos. A ranked bar chart shows which negative behaviours are most prevalent across the class, a donut shows the proportional split, and a full pupil breakdown ranks every child by their red total with stacked bars showing which specific behaviours are driving their count. A versus-average delta badge shows how far above or below the class average each pupil sits. Pupils with zero red dojos are called out separately at the bottom — a detail worth celebrating with the class.
Something went wrong, please try again later.
This resource hasn't been reviewed yet
To ensure quality for our reviews, only customers who have purchased this resource can review it
Report this resourceto let us know if it violates our terms and conditions.
Our customer service team will review your report and will be in touch.
£1.20