
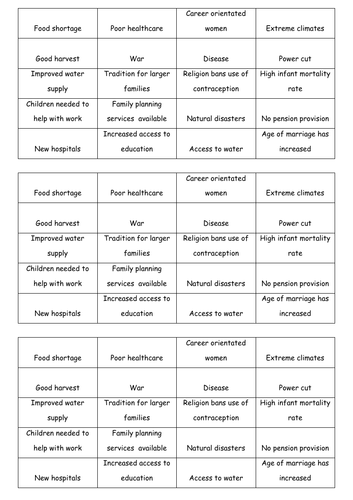
This can be used as a task within a lesson about population growth.
It is a series of factors for students to classify as mostly affecting either birth rate or death rate, then they can use them to create a spider diagram of the factors, adding an up or down arrow to show whether it would increase or decrease the birth rate or the death rate, also explaining why.
Something went wrong, please try again later.
This resource hasn't been reviewed yet
To ensure quality for our reviews, only customers who have purchased this resource can review it
Report this resourceto let us know if it violates our terms and conditions.
Our customer service team will review your report and will be in touch.
£2.50