
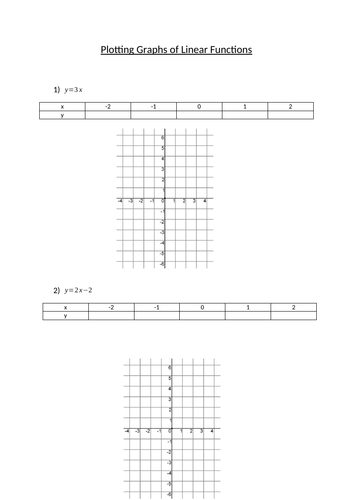
Taking function machines as a starting point, this presentation takes pupils from inputs and outputs, through to generating a table of values and finally plotting these values on a coordinate grid.
Pleas excuse the preview as it doesn’t display properly.
Good for introducing the idea of graphing functions at KS3 but also helpful in clarifying the ideas to lower ability KS4 pupils.
Something went wrong, please try again later.
This resource hasn't been reviewed yet
To ensure quality for our reviews, only customers who have purchased this resource can review it
Report this resourceto let us know if it violates our terms and conditions.
Our customer service team will review your report and will be in touch.
£1.00