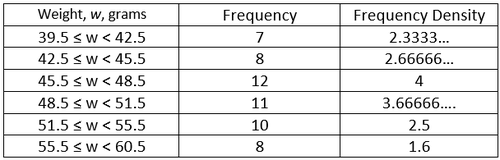


A worksheet with three continuous variables rounded to appear as discrete data. Pupils have to create suitable continuous class intervals for the pre-rounded values before drawing the histogram. Three tables showing the continuous intervals and frequency density are also given. (Technically the second question doesn't ask for a separate table, but pupils should be able to mark histograms from the table if peer or self-assessing).
Something went wrong, please try again later.
I found this an excellent resource and it saved me valuable lesson planning time. Thank you
Good practice and consolidation, which can be used to reinforce when it is appropriate to use histograms. Thanks for sharing.
Report this resourceto let us know if it violates our terms and conditions.
Our customer service team will review your report and will be in touch.
£0.00